Pound under pressure as GBP/USD tests yearly lows


GBP/USD fell to 1.3085 on Friday, remaining at its lowest level in almost a year. The main pressure on the pound comes from sharply rising expectations of further Fed tightening, which is supporting the US dollar.
Minutes from the October Fed meeting showed that the Fed is increasingly concerned about persistent inflation and acknowledges the need for additional rate hikes. Policymaker Christopher Waller called for more decisive action if price pressures continue to rise. Markets now estimate the probability of a 25-basis-point rate hike in December at 97.3%, with the chance of a 50-basis-point move at 2.7%.
In the UK, the situation is less straightforward. The Bank of England expects inflation to accelerate further by mid-2027 due to cumulative cost pressures, but some components of the October CPI proved fairly stable. Against this backdrop, markets have scaled back expectations of a BoE rate hike in December, further limiting support for the pound.
Yields on UK government bonds also fell following the inflation report, with the yield on 10-year gilts dropping to 5.29%. Although headline CPI reached 3.6% year-on-year, markets have become more cautious about further Bank of England tightening, adding to pressure on GBP/USD.
October UK retail sales will be the next key release, with zero month-on-month growth and 1.7% year-on-year growth expected. Stronger-than-expected data could temporarily support the pound, but the fundamental balance remains in the dollar’s favour due to much stronger expectations of Fed tightening.
Technical analysis
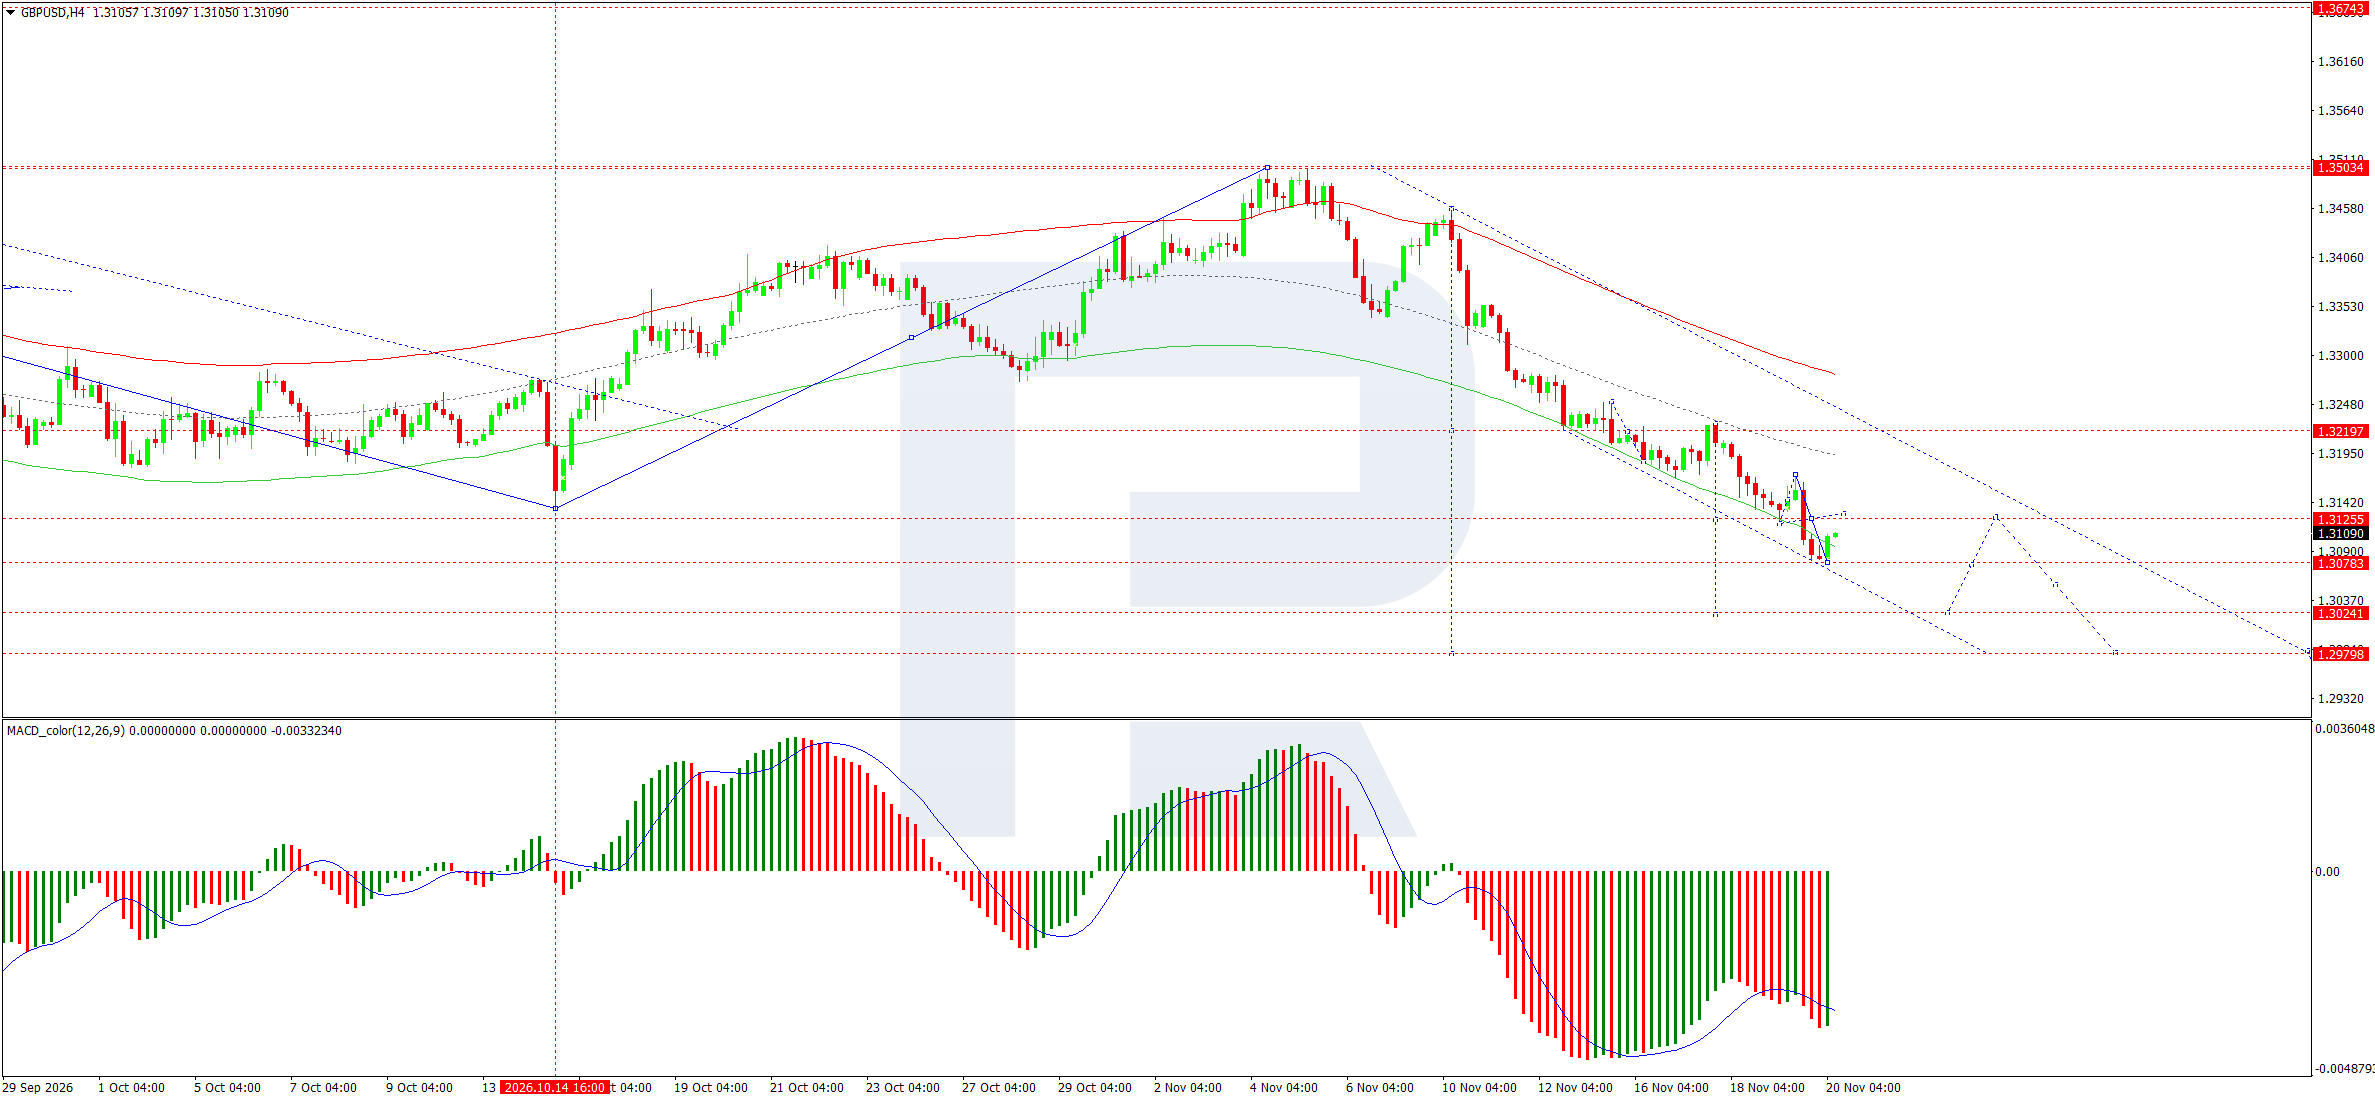
The H4 GBP/USD chart remains in a downtrend. After a reversal in early November, the pair has formed a succession of lower highs and lows while remaining within the descending channel. The MACD signal line is below zero and pointing downwards, indicating continued downward momentum. The nearest target on H4 is 1.3024.
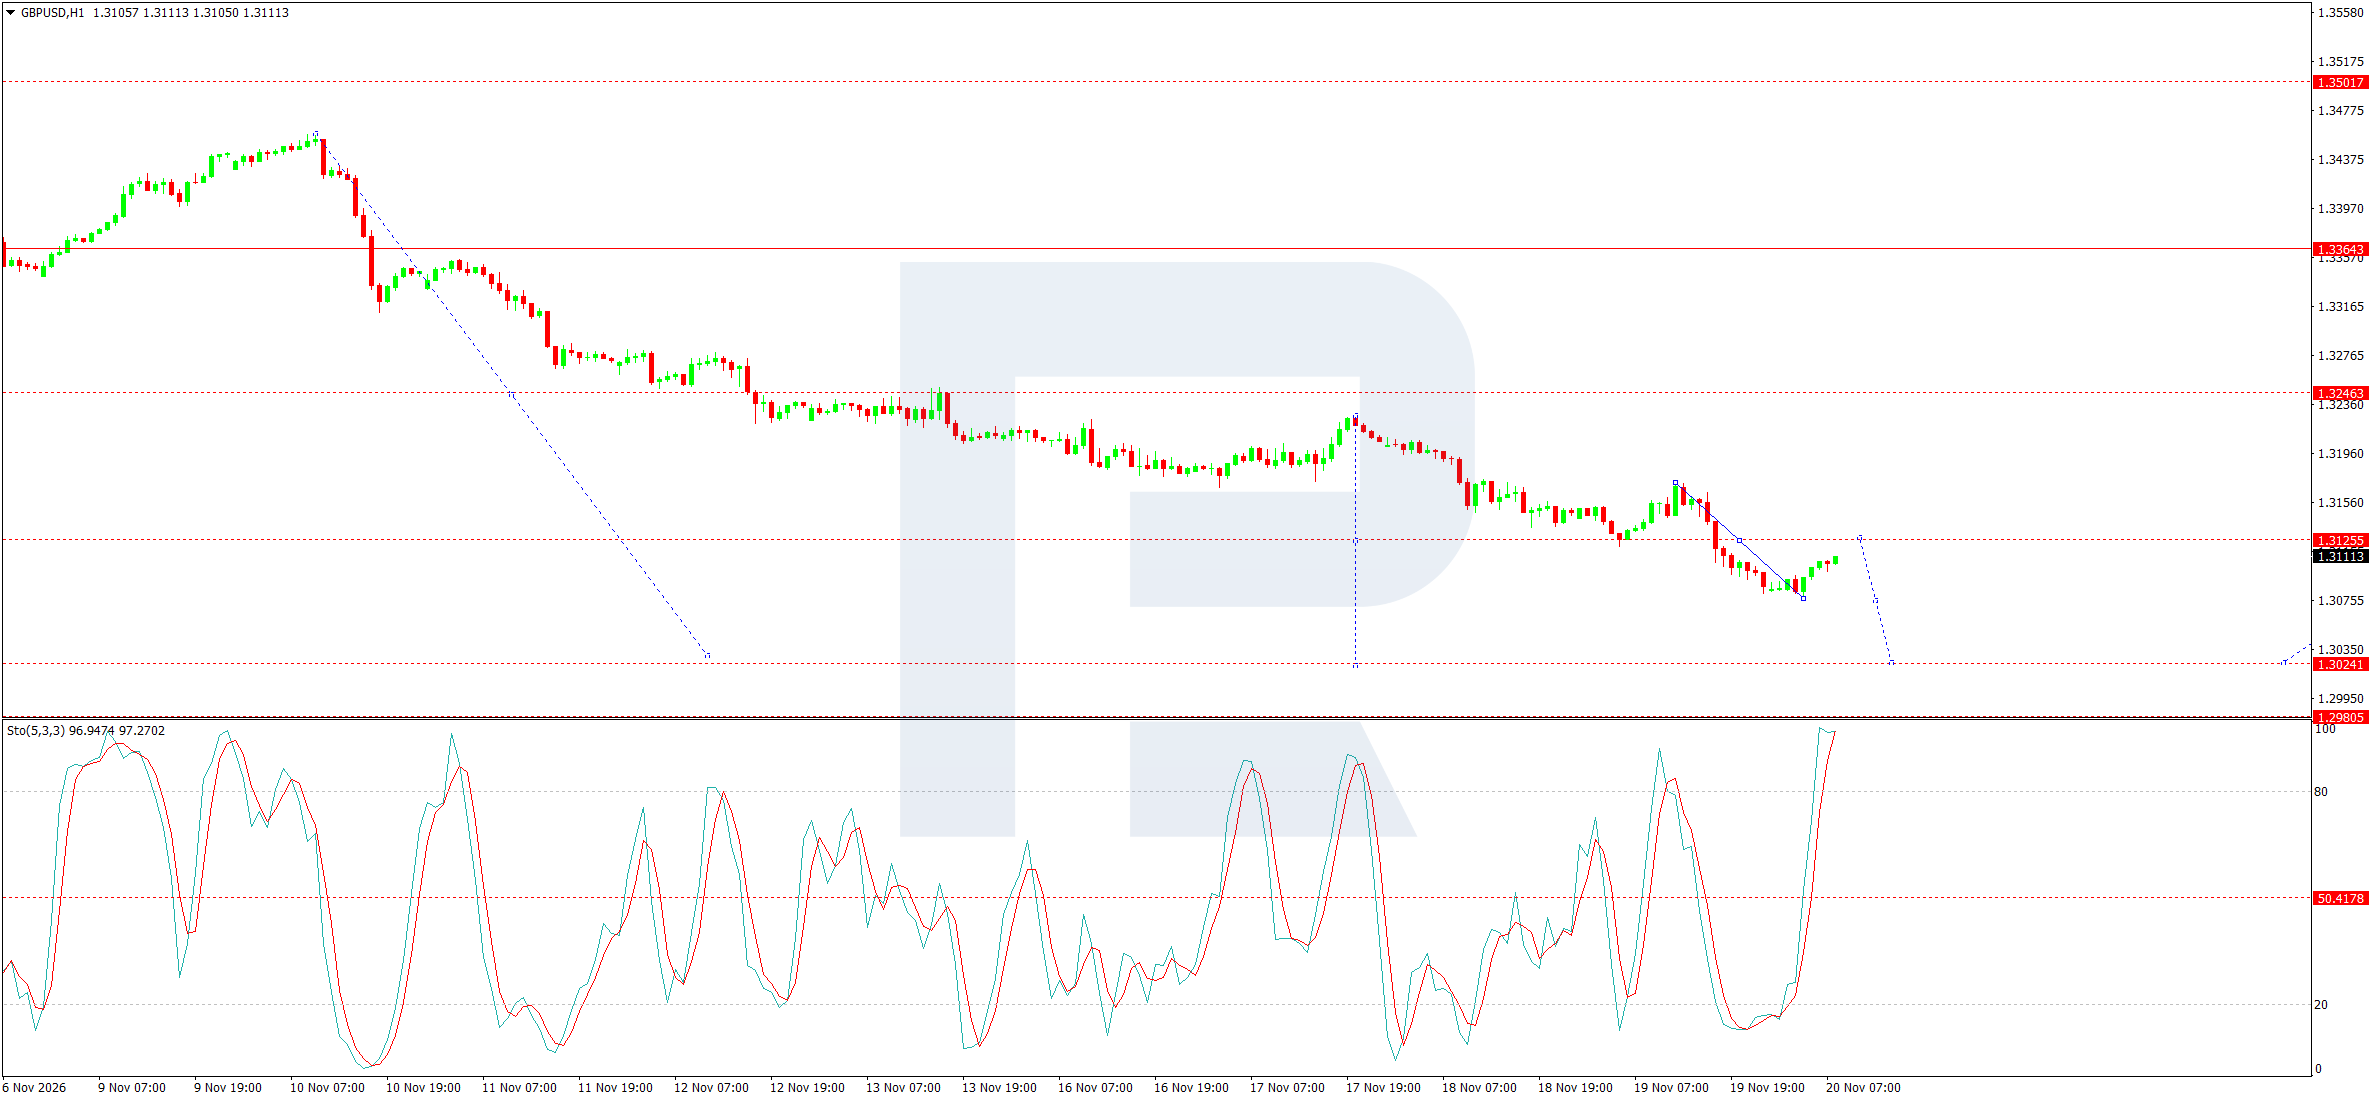
On the H1 GBP/USD chart, the pair rebounded from 1.3078 to approach 1.3125, where it had previously consolidated. For Friday, 20 November 2026, the baseline scenario assumes a test of 1.3125 from below. If resistance holds, a return to 1.3078 is likely. A break below this low would open the way towards 1.3024. Both Stochastic oscillator lines are above 80. A move out of the overbought zone would strengthen the signal for a resumption of the decline, with the 20 mark becoming the next reference point for the oscillator.
After reaching 1.3024, a rebound towards 1.3080 is possible. If the recovery is limited to this area, the next local downside target is 1.2980. This level corresponds to the continuation of the wave on H4 and may be reached beyond Friday’s session. The longer-range target of the downward wave, based on the chart markings, lies at 1.2584 and remains relevant while the trend holds. A close above 1.3125 on the hourly chart would postpone the intraday decline scenario and increase the likelihood of a deeper correction. In that case, the nearest recovery target would be the high of the previous upward move on the hourly chart, formed on 19 November.
Conclusion
GBP/USD has fallen to its lowest level in almost a year, weighed down by sharply rising expectations of further Fed tightening, with December rate hike probabilities now at 97.3% for a 25-basis-point move. While the Bank of England also expects inflation to accelerate, stable components in the October CPI and falling gilt yields have led markets to scale back BoE rate hike expectations, further weighing on the pound. The fundamental balance remains firmly in the dollar’s favour. Technically, the downtrend is intact, with resistance at 1.3125 and support at 1.3078 and 1.3024. A break below 1.3078 would open the way towards 1.3024 and potentially 1.2980, with the longer-range target at 1.2584. A close above 1.3125 would postpone the decline scenario and point to a deeper correction. October UK retail sales will be the next catalyst for the pair.
Author
RoboForex Analysis Department
RoboForex
RoboForex Analysis Department provides timely market insights, expert technical analysis, and actionable forecasts across forex, commodities, indices, and equities.

















