Positive risk appetite hitting the dollar, sterling supported

Market Overview
Political risk in the UK is now huge. With barbed attacks coming from all sides, Theresa May is finding herself increasingly isolated in trying to get her EU deal ratified in Parliament. She compares herself to Geoffrey Boycott, a stoic and obstinate cricketer from the 1970s and 1980s who battled on to get the job done. Boycott also famously upset several of his teammates along the way too, so quite an apt comparison then. However, can Mrs May get the job done? For all her admirable resilience, it is looking increasingly unlikely and the prospects of a No Deal catastrophic exit from the EU is growing by the day. She is also increasingly likely to face a leadership challenge as voice against her become ever louder. Volatility on sterling options have jumped across the board (one week, one month and three month options) spiking to levels not seen since June 2016 (the EU referendum) and sterling is now under significant selling pressure. Equities in the UK are also under pressure (especially UK centric ones) as the prospect of either a no deal or a Jeremy Corbyn government grows by the hour. Outside of the UK political bubble, the dollar is also feeling the pinch in the wake of lower than expected core CPI inflation earlier in the week and Treasury yields are falling. In spite of the US retail sales coming in better than expected yesterday, there is increasingly positive rhetoric coming out over the US/China trade dispute, also dding to downward dollar pressure, with suggestions that the US is ready to put on hold the next round of tariffs. Traders will be looking forward to Trump meeting President Xi at the G20 now with anticipation that some sort of agreement could be in the offing. Risk appetite has improved as a result, although again this is worth keeping an eye on after Trump’s Commerce Secretary Wilbur Ross notes that an agreement would be difficult to pull off before the tariffs are set to come in January.

Wall Street closed strongly higher to break a one week run of losses. The S&P 500 closed 1.1% higher at 2726, however, with futures giving back around -0.3% at the moment this has taken some of the sheen off the bounce. Asian markets are seeing a mixed session (Nikkei -0.6%, Shanghai Composite +0.5%) whilst European markets are feeling to benefit with FTSE and DAX futures around +0.5% higher so far after a choppy session yesterday. In forex, the focus will continue to be on sterling after yesterday’s rout, and currently there is a degree of support, although as European trading kicks off in earnest it will be interesting to see if this lasts. There is also a broad slip on the dollar. In commodities, the dollar weakness is again helping gold and silver to edge higher, whilst oil continues to build on its recent support.
Traders looking at the economic calendar will have an eye on the final Eurozone inflation numbers this morning at 1000GMT. It is interesting to see that headline inflation is expected to be revised higher to +2.2% (from +2.1 at the flash reading, and +2.1% as a final reading in September) whilst the core inflation is expected to be confirmed at +1.1% (+1.1% flash, +0.9% in September). The US Industrial Production numbers are at 1415GMT with +0.2% growth on the month, but given strong comparatives dropping out (+1.2% in October 2017) then the year on year number will see a drop back towards the low 4% area. Capacity Utilization is expected to improve to 78.2% (78.1% in September). Also keep an eye on the Kansas City Fed Manufacturing at 1600GMT. It is also worth watching out for ECB President Mario Draghi who is speaking at 0830GMT and the hawkish Bundesbank President Jens Weidmann at 1300GMT.
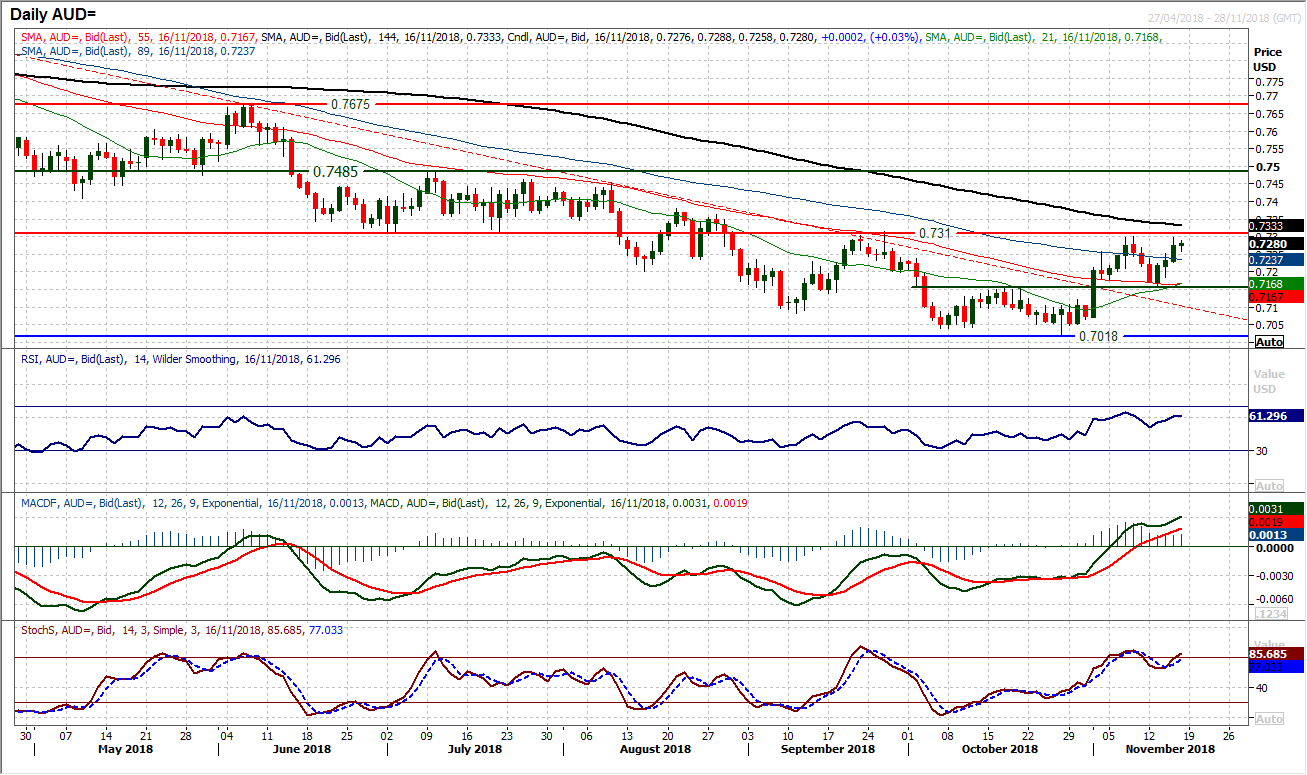
Chart of the Day –AUD/USD
Both the Aussie and Kiwi have been performing well against the backdrop of US dollar strength in recent weeks. The Kiwi is making solid ground, but the Aussie dollar is not far behind. The key level to watch remains $0.7310 which is a medium term pivot which also marks the neckline of a potential 10 week base pattern (head and shoulders bottom). The bulls responded encouragingly with support at $0.7160 (a previous breakout neckline) and then the buying pressure has resumed higher towards a test of $0.7310 again. Momentum indicators are increasingly positive, with the RSI holding well above 50, MACD lines again turning up above neutral and also the Stochastics crossing higher. This all points to the higher low at $0.7160 now being in place and pressure on $0.7310. A closing breakout would complete a base and imply around 270 pips in the coming months as a recovery. Next resistance would be $0.7360/80 and then $0.7450/85.
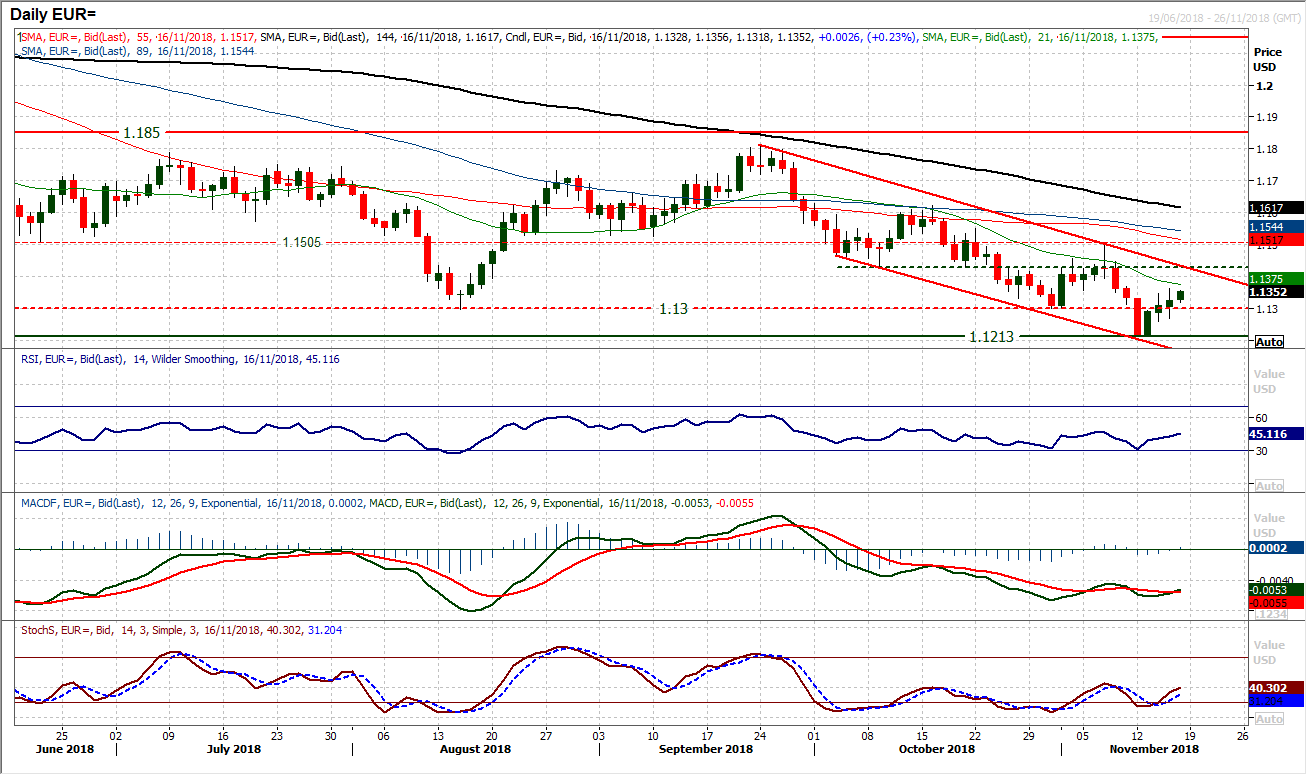
For the past eight weeks, the euro has been falling against the dollar and has now formed a downtrend channel. The rebound from Monday’s low helped to form the bottom of the channel and has left key support at $1.1213, however, a feature of downtrend channels is one of lower highs and lower lows. The latest reaction high at $1.1500 formed the top of the channel, but the downtrend is now falling around $1.1430 today. Rallies are therefore a chance to sell. There is a resistance band of overhead supply between $1.1300/$1.1430, but there is another indicator to watch here. The falling 21 day moving average (today around $1.1375) has been a very good basis of resistance for several weeks and is worth keeping an eye on. The momentum indicators have also unwound on RSI and Stochastics back towards levels where the bears have tended to re-assert themselves in recent weeks. The past couple of candlesticks have been positive but tentative and this would be another opportunity to sell soon. Initial support at yesterday’s low at $1.1270.
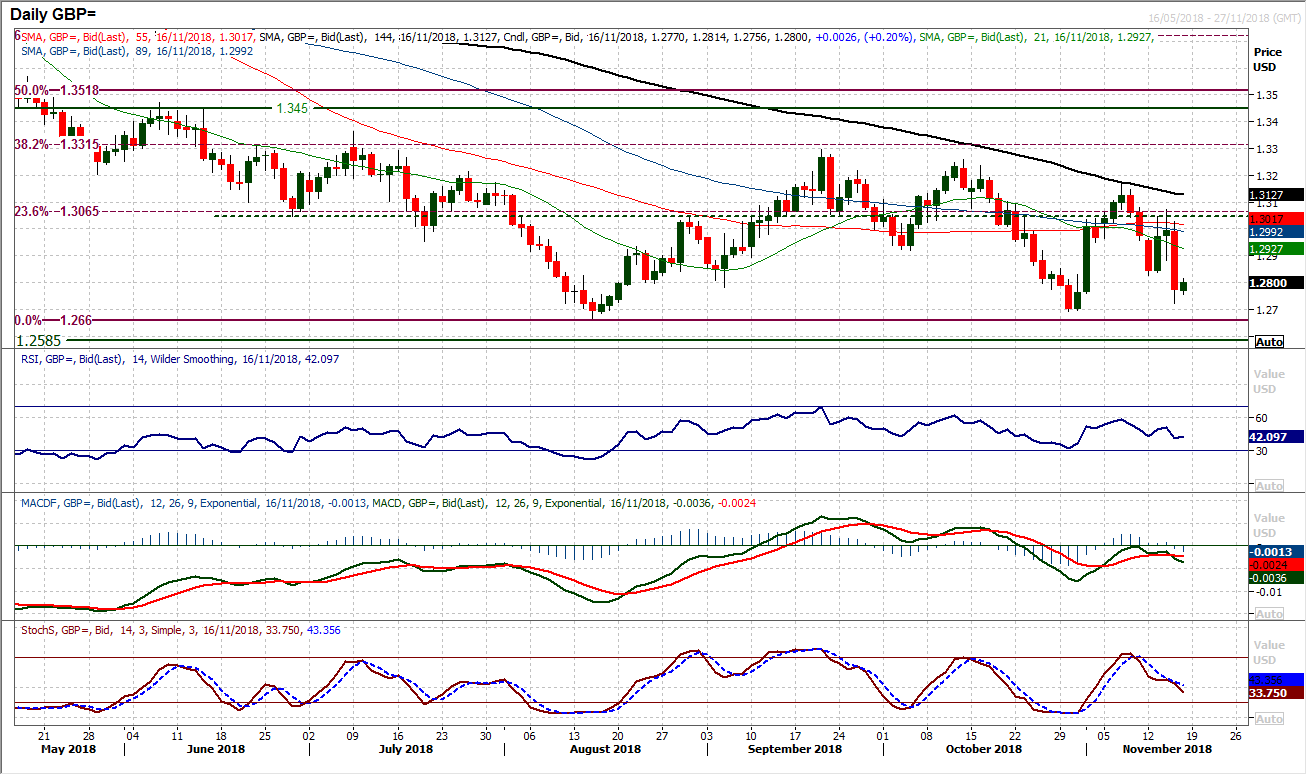
When political risk explodes, technicals take a back seat role. Yesterday’s huge bearish candle with a daily range of over 250 pips and a close lower of 215 pips shows how precipitous the selling pressure was yesterday. Technical momentum indicators are suitably corrective and a test of the key August low at $1.2660 is increasingly likely. There has been a near term rebound off $1.2722 but sterling remains tied to newsflow on the politics of Brexit. The hourly chart shows resistance now $1.2825/$1.2885 which will be seen as overhead supply initially. However, it is difficult to see sterling rallying to any sustainable degree whilst there is such considerable political uncertainty. The risk is certainly for a test of $1.2660/$1.2695 and below.
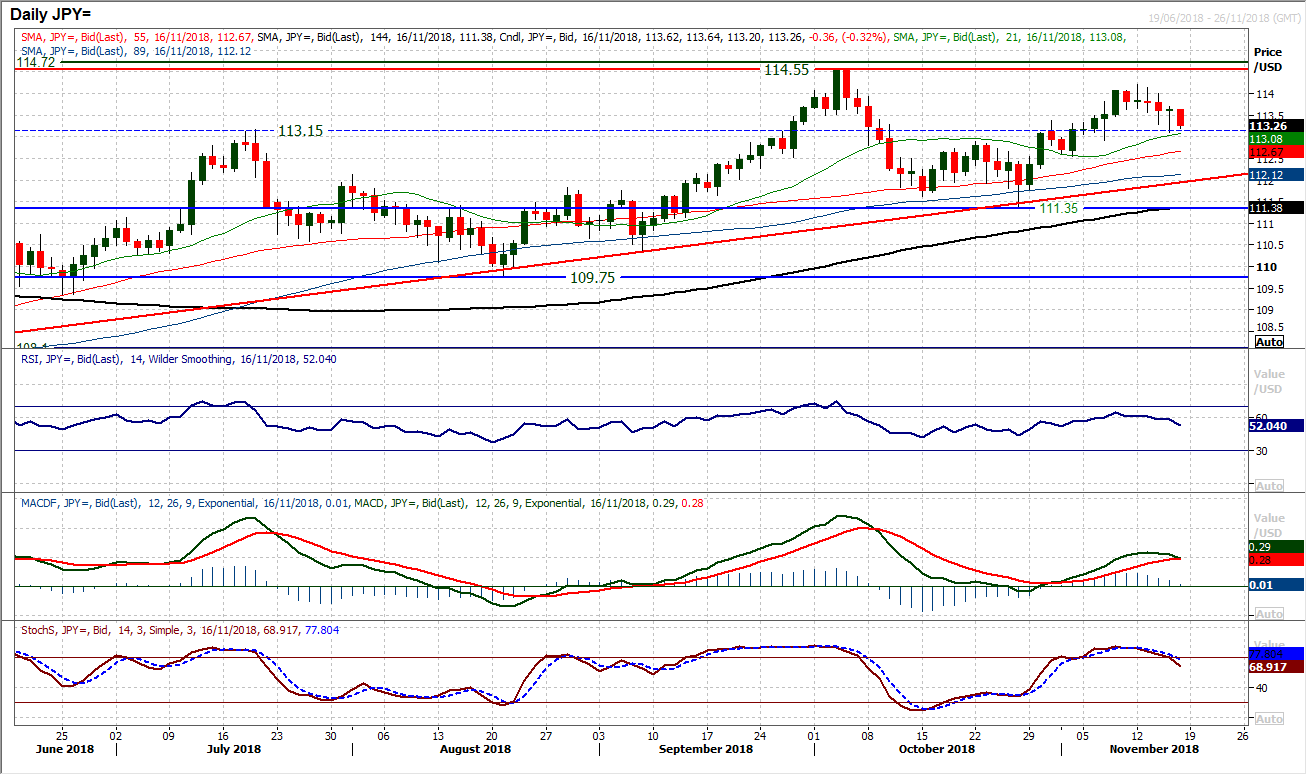
The near term corrective move on Dollar/Yen has gathered momentum as the week has progressed. Candlesticks have either been neutral or negative throughout this run and despite a late rebound into the close yesterday it was interesting to see oil once more lower in the early moves today. The momentum indicators are beginning to show the deterioration now, with a bear cross on Stochastics close to confirmation and a similar bear cross closing in on the MACD lines. If these were seen, then the RSI falling below 50 would complete to set. However this still looks to be a near term unwinding move and the old breakout around 113.15 is a basis of support. For now this is a minor blip on the medium to longer term trend higher (the 5 month uptrend comes in around 112.00). There is therefore room for further slippage. The hourly chart shows initial support at 113.10 but 112.55 is a key near term support that if gave way would further the correction. Once this correction plays out this will be a good chance to buy, but for now the slip lower is on.
Gold
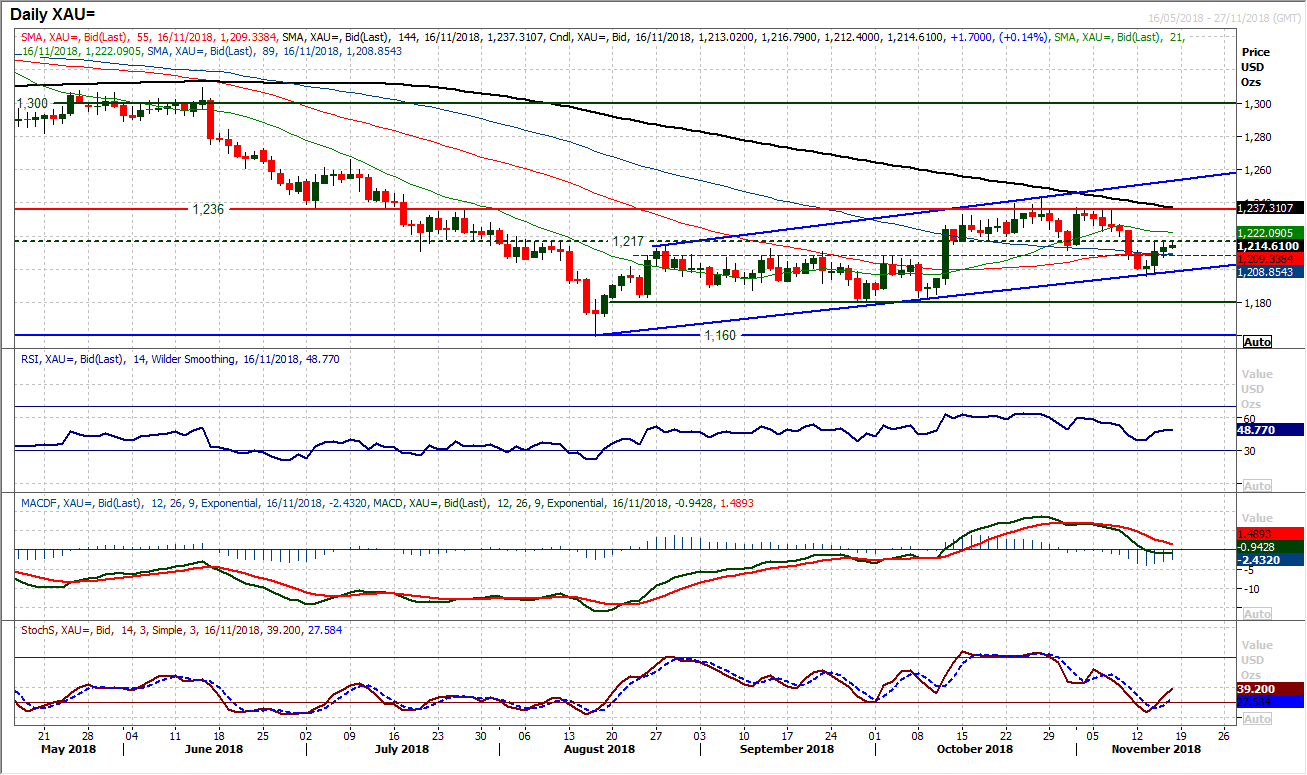
The rebound from $1196 on Tuesday has held on to what now looks to be an uptrend channel on gold. This is a channel that has formed over the past few months but there is a band of pivot resistance between $1208/$1217 that needs to be overcome to reinvigorate the bulls again. A close above $1217 would continue to pull positive closes on gold and given that momentum indicators are now ticking back higher there is an improving aspect to momentum now. However, the past two sessions have failed under $1217 and is clearly a level that the bulls need to breach. Despite this though there is a gradual sense of improvement coming in the positive closes and pressure is mounting on $1217. A move above would open $1236 again. Momentum indicators are threatening to improve again but this seems to be a near term crossroads with the RSI stuttering under 50 and MACD lines flattening off. Initial support now $1208.
WTI Oil
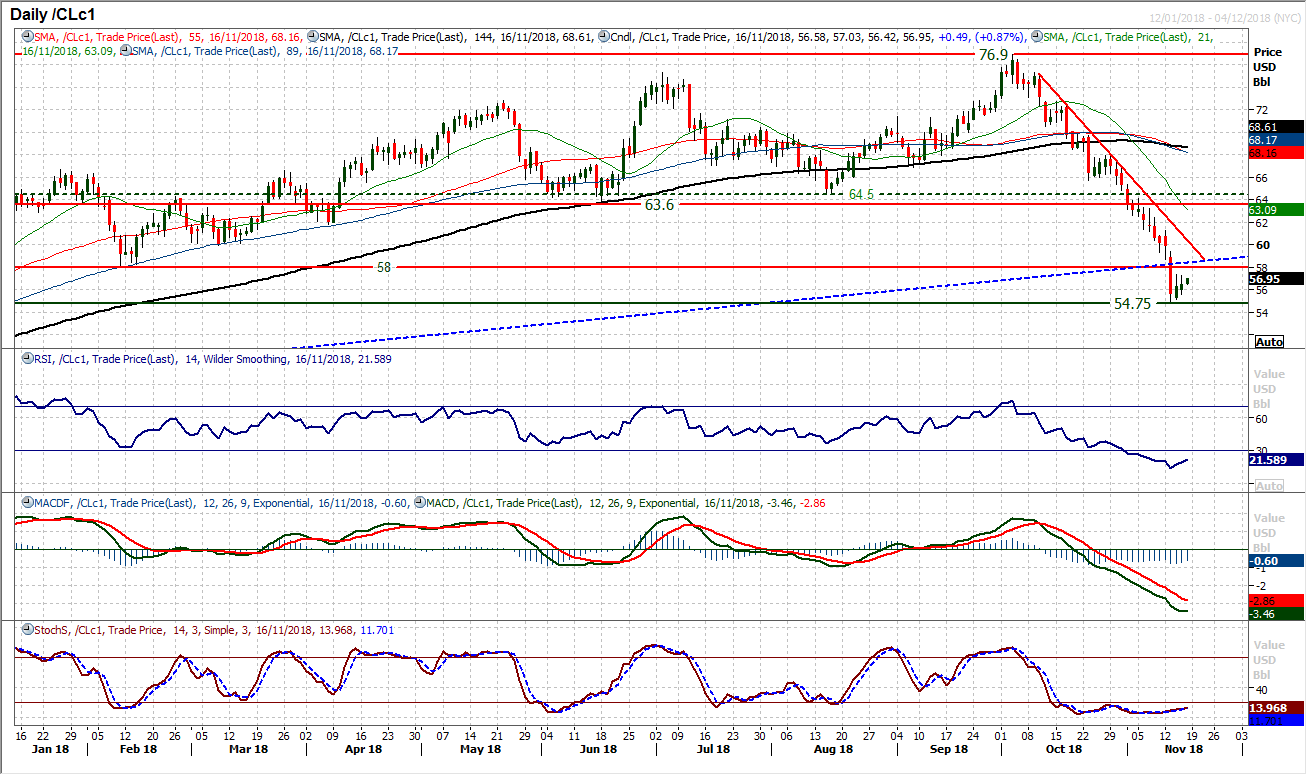
It would seem as though the sellers have lost their impetus, for now, as a second positive close was seen yesterday and the market is trading higher again today. These seem to be baby steps right now which still leaves the prospect of playing for a technical rebound quite a risky game. There is much to unwind (the downtrend resistance comes in at $60.35 today), whilst there is overhead supply between $58/$60, but for now the market is edging higher. However, perhaps the most remarkable feature of yesterday’s rather muted positive session was how muted it was, given the huge increase (once again) in the EIA crude oil inventories. Could this be taken as a positive sign? Initial support at $55.60, whilst a close above $57.35 helps to improve the outlook of the recovery.
Dow Jones Industrial Average
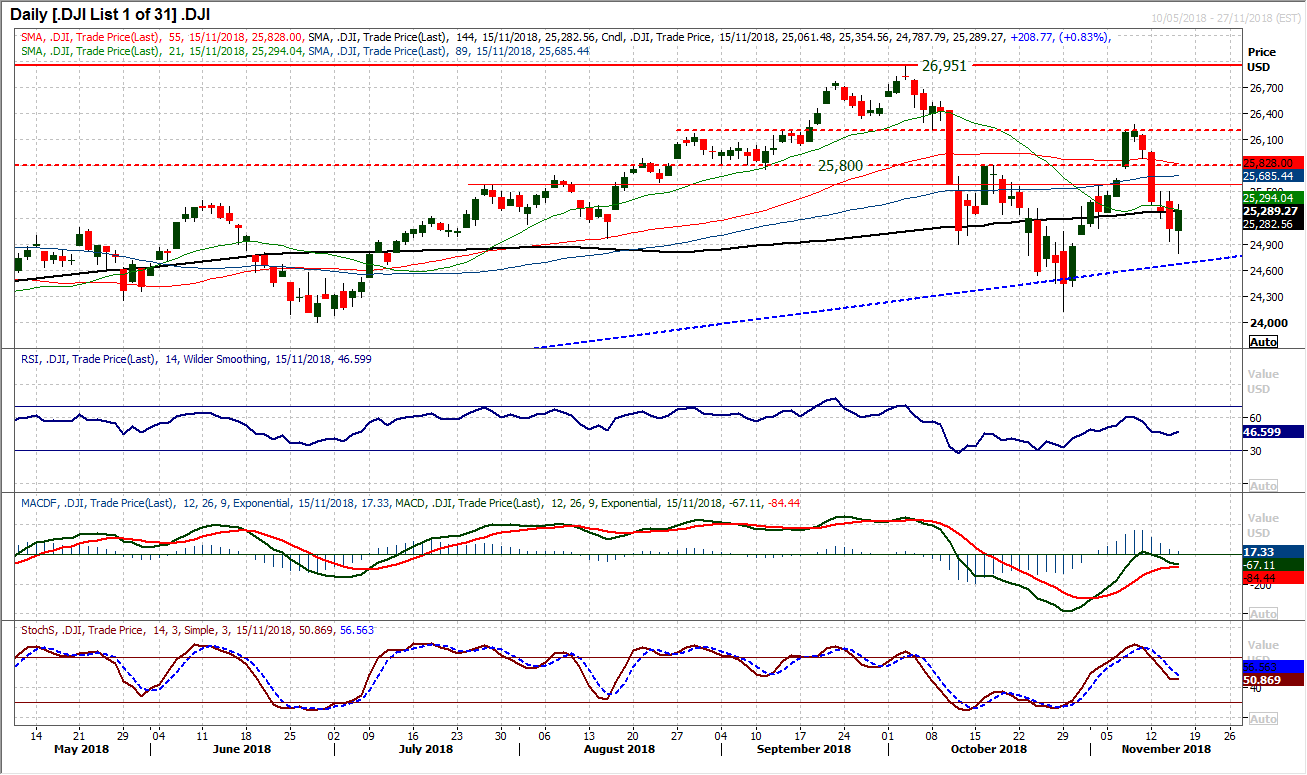
Intraday volatility remains elevated as another session encapsulated the Average True Range of around 450 ticks. This time though, the bulls fought back from initial selling, to close higher on the day and break a sequence of four decisively negative sessions. The question is now whether one and be turned into two in a row? A feature of this corrective move over the past week is that the market has consistently posted lower highs. Yesterday’s high at 25,355 is the initial resistance, but the bulls will be looking at Wednesday’s 25,501 as a marker too, whilst there is an overhead pivot resistance band 25,580/25,800. Yesterday’s low at 24,788 is now a basis of support to work from too.
Author

Richard Perry
Independent Analyst


