Position tracking a handful of forex pairs

USD/CAD has been moving sideways to up now steadily after the CAD began giving up some of its nice gains from the past month. Tight conditions set markets up for breakouts and the USD especially remains muted to mostly bearish overall giving the basket of currencies it measures against, some momentum. The US Dollar Index is looking like some of the same we’ve been seeing since the end of April. This past week we saw considerable upside on Thursday which soon thereafter gave up all gains following the US Non-Farm Payrolls which despite being about 100K jobs lesser than the consensus estimate, remained a tad bit bearish for the greenback overall.
Perhaps the chiseling lower since then could be different as it isn’t occurring from a swing-low, but the fact that the one-day rally got negated on not such good economic news suggestive of the speculation that perhaps a swing-high may be in. There is the potential that a bear-flag formation forms, more discernable off the daily charts. A bounce may develop off the lower parallel of the pattern that is forming, but again it should be minimal. If we fall below the May low at 89.53 breaks the next levels of support is at 89.20 and following that a bigger gap into the 2018 low at 88.25. This last support level would be a major test as it is a level that began over a decade ago.
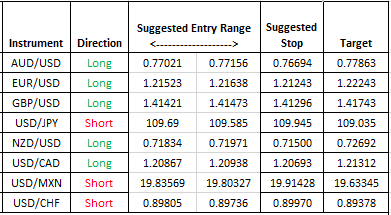
Below we put out trade ideas which we are currently in from the lower end of the "suggested entry range". Most times, we like to wait for the profit targets to achieve but have taken off winning trades sooner based entirely by watching the Dollar index.
Currently Active trade
Is there an instrument you wish for us to analyze? Drop us a note. Come visit us at our website and and fill out a contact form and tell us about your experience with trading financial instruments and commodities. We present weekly trade ideas on Twitter @tradeguidance and point you in the direction of the articles we like to publish on FxStreet. Tweeting only with the intent of helping traders learn!
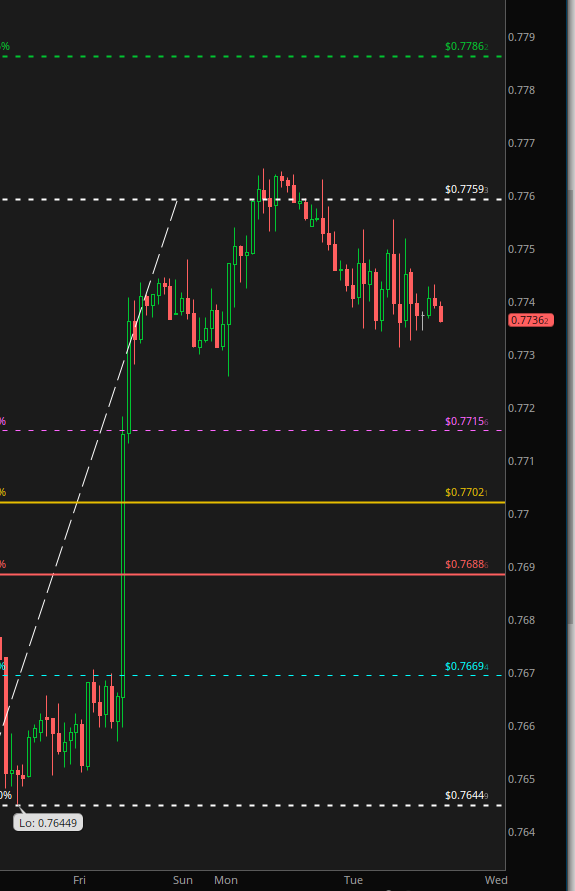
Chart of AUD/USD
Author

Murali Sarma
Trade Guidance, LLC
Murali Sarma is a private investor and trader, dealing in currencies, commodities (grains, energies, metals, bonds, indices) and stocks.


