PMIs eyed as EUR/USD rebounds from support
EUR/USD
US Federal Reserve Chair Jerome Powell was in the spotlight on Wednesday, testifying on the Semi-Annual Monetary Policy Report before the Senate Banking Committee. Powell reaffirmed his commitment to tame inflation pressures, and also acknowledged the risk of recession, though had little to say on the future of interest rate hikes. Major US equity indexes rose on the session, while US yields navigated lower across the curve. The safe-haven greenback pushed lower and EUR/USD consequently caught a relatively healthy bid.
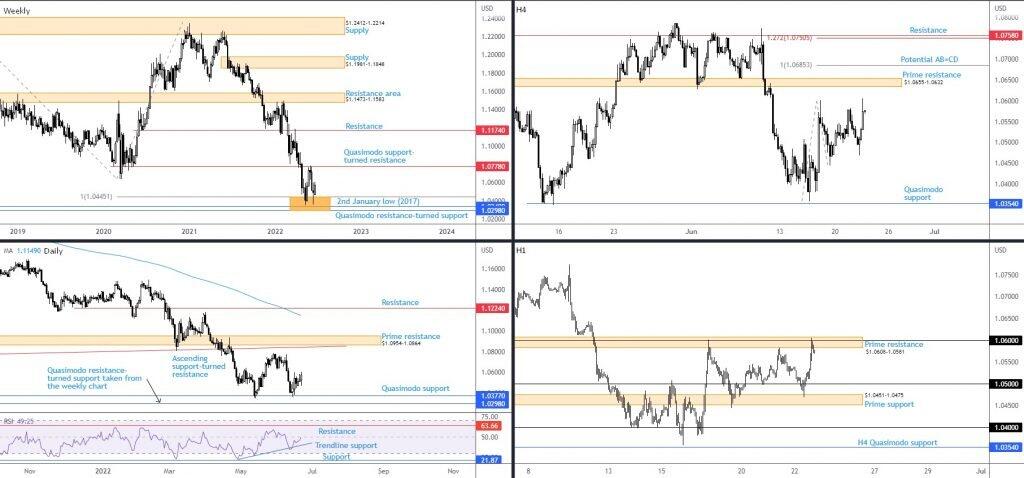
The technical framework demonstrates that buyers have the upper hand on the bigger picture for the time being, elevated out of support on the weekly timeframe between $1.0298 and $1.0445 (composed of Quasimodo resistance-turned support, 2nd January low [2017], and a 100% Fibonacci projection [AB=CD harmonic bullish formation]). This, as underlined in previous analysis, is reinforced by the daily timeframe’s Quasimodo support at $1.0377 and the relative strength index (RSI) threatening to journey above the 50.00 centreline, action that implies positive momentum (average gains exceeding average losses). Upside targets on the higher timeframe call for attention at weekly Quasimodo support-turned resistance at $1.0778, sheltered beneath daily prime resistance at $1.0954-1.0864, as well as a neighbouring ascending support-turned resistance. Note, however, that the overall bias is to the downside in this market, shaped by way of a clear-cut trend since 2021.
For those who read Wednesday’s technical briefing you may recall the following text on the H1 chart:
Attention is on the H1 chart for now, particularly directed towards $1.05 and the neighbouring prime support at $1.0451-1.0475. A test of $1.05 may see price whipsaw (run stops) beneath the psychological number and tap into willing bids out of $1.0451-1.0475.
As evident from the H1 chart, we can see that early London hours on Wednesday saw price whipsaw $1.05 to test the H1 prime support. Subsequent price action has since touched gloves with a familiar H1 prime resistance at $1.0608-1.0581 which houses $1.06. While a reversal from the H1 zone could unfold, rupturing the current H1 prime resistance is certainly on the table, with H4 prime resistance waiting to welcome price at $1.0655-1.0632.
Technical expectation
Knowing that the EUR/USD is currently bid from higher timeframe support—in spite of a decisive downtrend—a run of stops above H1 prime resistance at $1.0608-1.0581 may draw a fakeout to H4 prime resistance nearby at $1.0655-1.0632. For the most part, this will be considered a bearish play, as sellers could enter from $1.0655-1.0632, looking to fade buy-stop momentum above the H1 zone and also $1.06.
AUD/USD
The Australian dollar concluded Wednesday’s session off worst levels versus the greenback as risk sentiment turned positive amid US trading hours, and the safe-haven US dollar shifted to the downside.
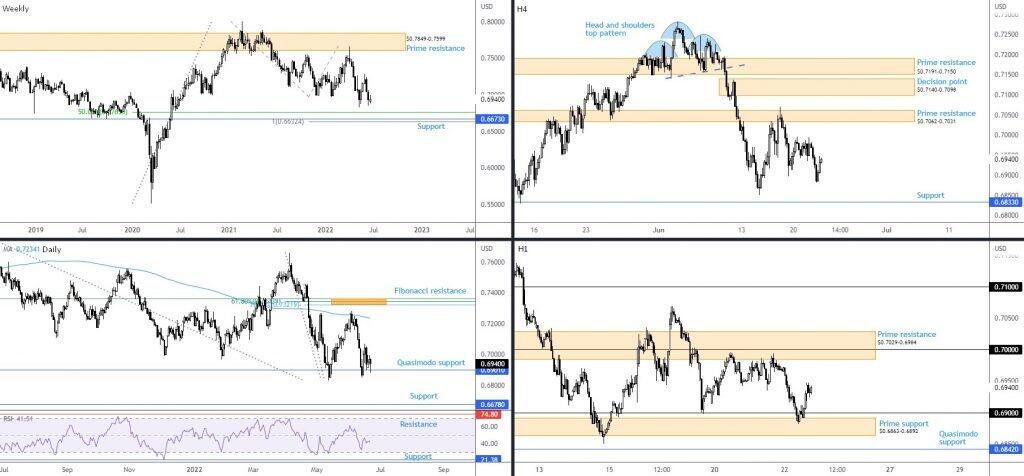
The day also had daily price reconnect with Quasimodo support from $0.6901, a level serving as a floor since 14th June. Yet, the test is unlikely to have gained enough bullish conviction, according to the weekly timeframe. Attention remains directed towards weekly support between $0.6632 and $0.6764, which is strengthened by the long-term bearish trend. Add this to the daily relative strength index (RSI) registering minus 50.00 values since early June, and the pendulum is swinging in favour of further losses. If sellers do indeed demand control, and the unit makes it below $0.6901, daily support is visible at $0.6678.
Looking across to the H4 and H1 charts at the moment, price recently whipsawed under $0.69 into H1 prime support at $0.6863-0.6892 during European hours yesterday. This was a noted setup to be aware of in Wednesday’s technical briefing:
An alternative (potentially bullish) scenario worth noting, assuming sellers take control, is a whipsaw through $0.69 to H1 prime support at $0.6863-0.6892.
Overhead on the H1 scale, prime resistance at $0.7029-0.6984—houses the widely watched $0.70 level—is now in sight. Given psychological values, particularly big figures like $0.70, a whipsaw above the number could play out if we retest the prime resistance, which may trigger bearish flow. However, do bear in mind that circling just above the H1 zone is H4 prime resistance drawn from $0.7062-0.7031.
Technical expectation
Having noted the overall trend facing southbound, a whipsaw of $0.70 to the H1 prime resistance, or a whipsaw of the H1 zone into H4 prime resistance are scenarios sellers are likely watching closely.
USD/JPY
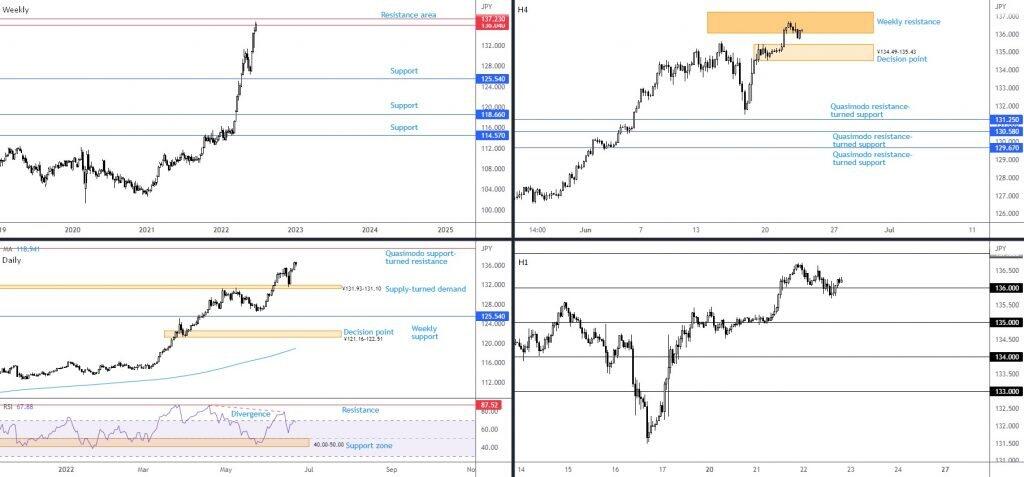
It was a mild session for the USD/JPY pairing on Wednesday, as Powell offered little to work with on day one of his two-day testimony before the Senate Banking Committee. As you can see, weekly price continues to shake hands with resistance, made up between ¥137.23 and ¥136.04. Despite the resistance, which is extended from as far back as 1998, the currency pair is rooted within a dominant primary bullish uptrend, which made its presence felt at the beginning of 2021.
Against current weekly resistance, nonetheless, scope to advance is seen on the daily chart to Quasimodo support-turned resistance at ¥139.55. This implies that the H4 decision point from ¥134.49-135.43 could welcome price action, which happens to hold the ¥135 figure within on the H1 timeframe.
Technical expectation
Given there is a clear H4 decision point at ¥134.49-135.43 that resides nearby, in a market trending northbound, a drop beneath ¥136 to ¥135 could be seen before buyers attempt to overrun the current weekly resistance area between ¥137.23 and ¥136.04.
GBP/USD
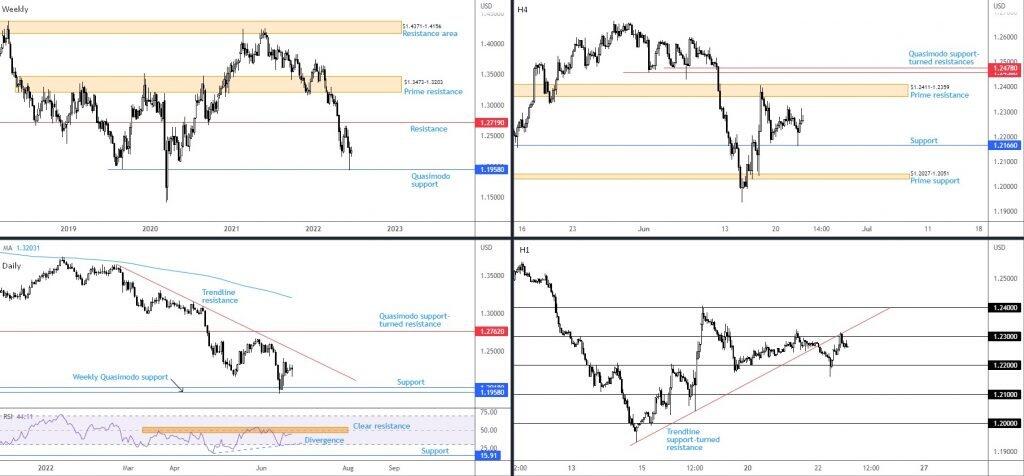
Inflation in the UK refreshed a four-decade high on Wednesday, recording 9.1 per cent year on year in May. This comes as the Bank of England (BoE) anticipates annual inflation to clock an eye-watering 11 per cent in October. Shortly after the release, sterling cracked beneath $1.22 and touched a low of $1.2161, running stops and forming what’s known as a ‘bear trap’.
Subsequent price action observed the currency pair explore higher levels and cross swords with $1.23 and a H1 trendline support-turned resistance, extended from the low $1.1933. Sellers made a show during US hours from the aforementioned levels, but has yet to deliver much. Supporting the whipsaw beneath $1.22 was H4 support coming in at $1.2166, with H4 showing upside free until H4 prime resistance at $1.2411-1.2359 (contains $1.24 on the H1).
In terms of where we stand on the bigger picture, limited change has been seen. Therefore, the following text is taken from previous technical research on the weekly and daily timeframes:
In a market demonstrating a downside bias (primary bear trend) from February 2021 tops ($1.4241), as well as a long-term downtrend since late 2007 tops at $2.1161 (check monthly timeframe), an impressive lower shadow took shape on the weekly timeframe last week from Quasimodo support at $1.1958. This is not a hammer candlestick formation, though, of course, does invite bullish undertones given the size of the lower shadow. Overhead on the weekly timeframe casts light on resistance at $1.2719. A little closer to home, however, is daily trendline resistance, taken from the high $1.3639, with a break here pointing to daily Quasimodo support-turned resistance at $1.2762 (placed just above the weekly resistance at $1.2719). Finally on the bigger picture, the daily timeframe’s relative strength index (RSI) is testing resistance around the 50.00 centreline, following positive divergence.
Technical expectation
Based on current chart studies, H1 price is poised to run above $1.23 to approach $1.24 and H4 prime resistance at $1.2411-1.2359. Breakout buying, therefore, will likely be viewed as a strategy north of $1.23 in the event an upside breach takes shape.
Author

Aaron Hill
FP Markets
After completing his Bachelor’s degree in English and Creative Writing in the UK, and subsequently spending a handful of years teaching English as a foreign language teacher around Asia, Aaron was introduced to financial trading,


