Plunging Stocks to Push Gold Higher? Fat Chance!

The bearish case for gold continues as fresh new bearish confirmations have just emerged. You have already read about gold’s huge weekly volume, gold stocks’ underperformance and many other factors. Yesterday’s session provides us with even more bearish details. But, there’s one thing that looks promising for gold bulls – the possibility of a big and sharp decline in the stock market. Some expect money coming out of the stock market to flow into precious metals, thus pushing their prices higher. As much as we love gold (and silver even more) as a very long-term investment, in today’s analysis, we dismiss the above stock-based hope.
However, before we move to the above discussion, let’s check yesterday’s price performance of gold miners (charts courtesy of http://stockcharts.com).
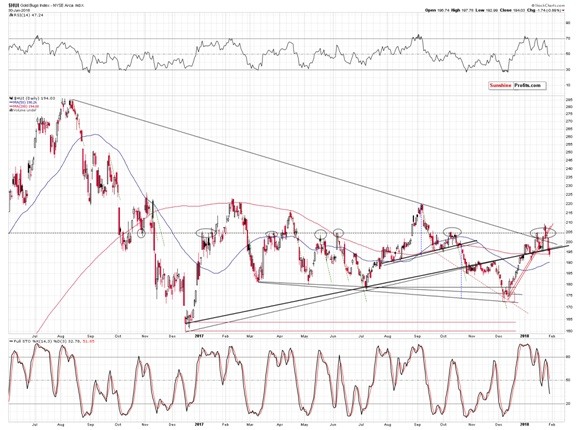
In short, gold miners broke below all important nearby support levels that could be broken:
-
The mid January high.
-
The early January high.
-
The late January low.
-
The 205 level (invalidating the breakout).
-
The declining, medium-term resistance line (invalidating the breakout).
-
The rising, medium-term resistance / support line.
-
The rising short-term (red) resistance / support line.
The implications of the above are very bearish and they are confirmed by the sell signal from the Stochastic indicator.
Still, it is not the decline in gold stocks by itself that’s so bearish. It’s its relationship with gold.


Both of the above charts show that the underperformance of gold stocks is clearly underway. While gold closed yesterday’s session relatively nearby to the previous closing prices, the HUI Index once again closed visibly lower.
Consequently, we see another sizable move lower in the HUI to gold ratio. The implications of this underperformance are bearish.
Having discussed the short-term developments, let’s discuss the main topic of today’s analysis – gold’s link with the main stock indices.
What about Gold and Stock Market?
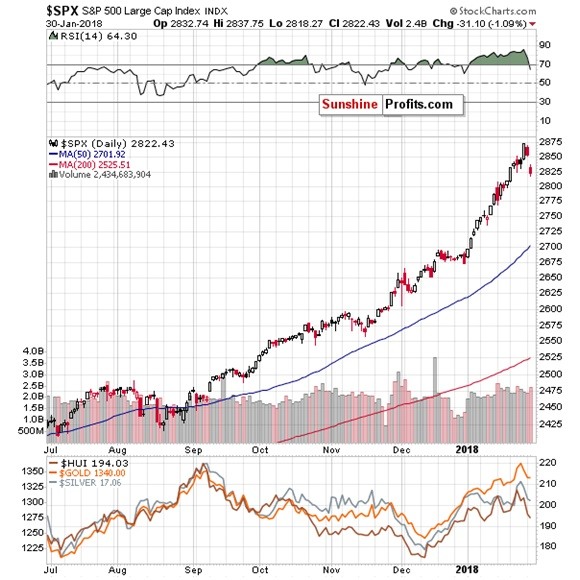
Let’s start with the stock market itself. As Paul correctly expected, the general stock market plunged. Does this mark the start of a 2008-like decline? Time will tell, but the thing that we would like to discuss today is what could take place in the precious metals market if a bigger decline is indeed seen in stocks (not necessarily as big as in 2008).
Let’s start with looking at the correlations, using our Correlation Matrix.
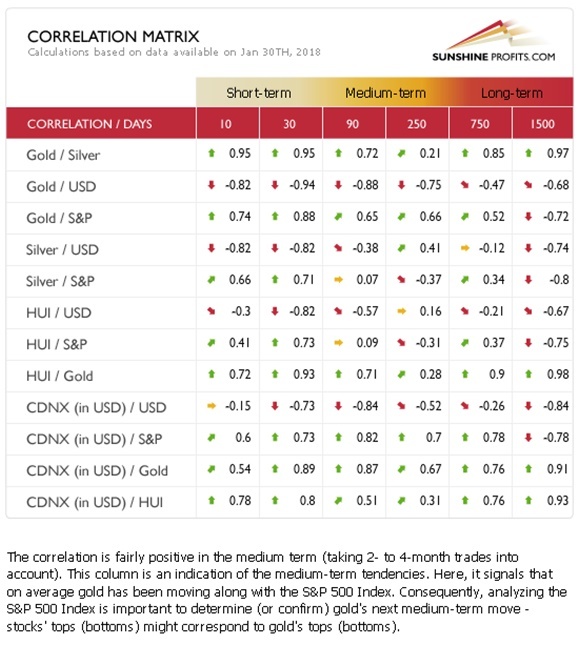
The above description is for the 90-trading-day column and the Gold / S&P 500 row. Indeed, the correlation in the past 90 trading days was rather positive, but the strength of the link is nothing to call home about. It’s more visible in the case of the past 30 trading days as both markets moved in tune (mostly rallying). So far there’s nothing that would indicate a negative relationship between stocks and gold – in fact, it seems that stocks could rally and decline along with gold in the coming months.
The longest analyzed time-frame, however, (1500 trading days) shows visibly negative correlation. No wonder – in the past 6 years gold moved lower, while stocks moved higher.
This gives us an indication that the general rule that we presented in the opening paragraph of today’s analysis may be true and the money that will flow out of the stock market will move into precious metals. But, it may take years for the process to materialize. It’s pointless to expect this to be of any help in the short- or medium term. Even a yearly decline might not be enough for the above factor to kick in.
Before moving further please note that the link between gold and the USD index is much more stable, especially in the short term. Consequently, if gold and stocks are both affected by a move in the USD, then this will be the key driver for gold. A move in the stock market would, in this case, be a result and not the cause. Given the current situation in the USD Index, the above scenario seems to be likely.
We described the details behind the gold to S&P 500 ratio on Monday and these comments remain up-to-date. Today we would like to add that even if stocks decline faster than gold, then there’s still room for the ratio to move higher before it changes anything regarding the outlook for both the ratio and the price of gold.
But will the ratio rally at all? Back in 2008 during the decline, the ratio moved in tune with gold, not against it – at least in the first part of the decline.
All in all, based on the factors that we have discussed so far, it seems that the link between gold and the general stock market is somewhat unclear.
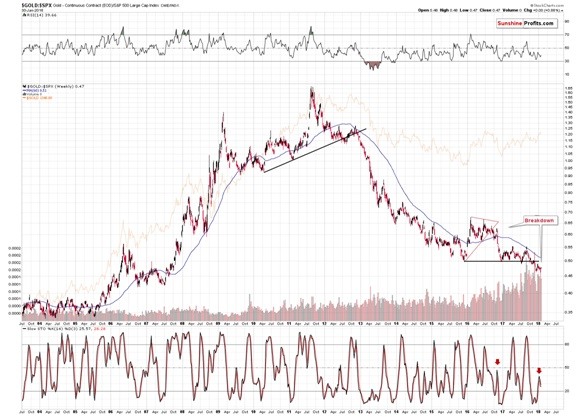
This brings us to the most important part of today’s gold – S&P 500 Index analysis. This part will make the link much clearer, but not in the way many gold investors would expect.
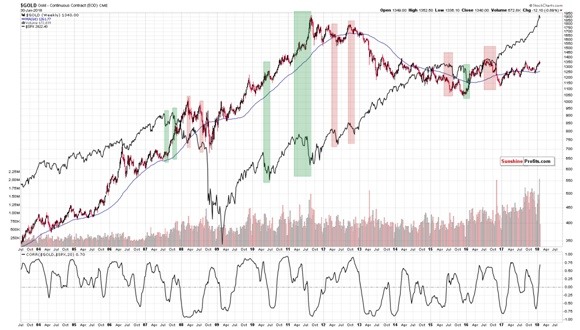
The above chart features gold (candlesticks) along with the S&P 500 Index (solid black line). We marked the bigger declines in the latter with semi-transparent rectangles.
The green rectangles represent cases when gold rallied during a decline in the stock market and the red rectangles represent cases when gold declined along with the stock market.
What’s one thing that – right from the start – differentiates between the above two kinds of reaction? Autocorrelation. Autocorrelation is a fancy way of saying that what happens first, makes the same reaction likely, which makes the follow-up to the follow-up likely to be the same as well – and so on. In other words, the way gold initially reacted to the decline in the S&P 500 was the way in which it kept on reacting in the following weeks and – sometimes – months.
What kind of price action did we see yesterday and on Monday? The S&P declined along with gold. So, what’s the likely impact that a declining stock market is going to have on the precious metals market? It’s likely going to be negative in the following weeks and – perhaps – months.
Summing up, the USD’s epic turnaround along with gold’s extraordinary weakness relative to the USD’s intraday decline along with multiple bearish confirmations paint a very bearish picture for the precious metals market for the following weeks. The situation was very bearish for PMs based on the above, but the record-breaking weekly volume in gold took the bearishness to a new – even more extreme – level. This week’s very significant underperformance in gold stocks serves as a perfect bearish confirmation.
The declining stocks market is often viewed as something that could trigger a rally in gold, but it doesn’t seem that it will be the case in the following weeks. Conversely, it seems likely that declining stock market will have negative impact on the precious metals sector.
Want free follow-ups to the above article and details not available to 99%+ investors? Sign up to our free newsletter today!
Author

Przemyslaw Radomski, CFA
Sunshine Profits
Przemyslaw Radomski, CFA (PR) is a precious metals investor and analyst who takes advantage of the emotionality on the markets, and invites you to do the same. His company, Sunshine Profits, publishes analytical software that any


