Penn Virginia Corp ($PVAC) getting ready to bounce?

Another blog on a great looking Energy producer. Yes, this sector has been under a strong bearish trend. But, there are some names that have better structures than others. Penn Virginia Corp chart has a great technical chart. As with the MTDR Blog I did a few weeks back, I am going to compare PVAC to XLE to get an idea of when this stock can strike a low. Lets dig in.
Penn Virginia Elliott Wave View
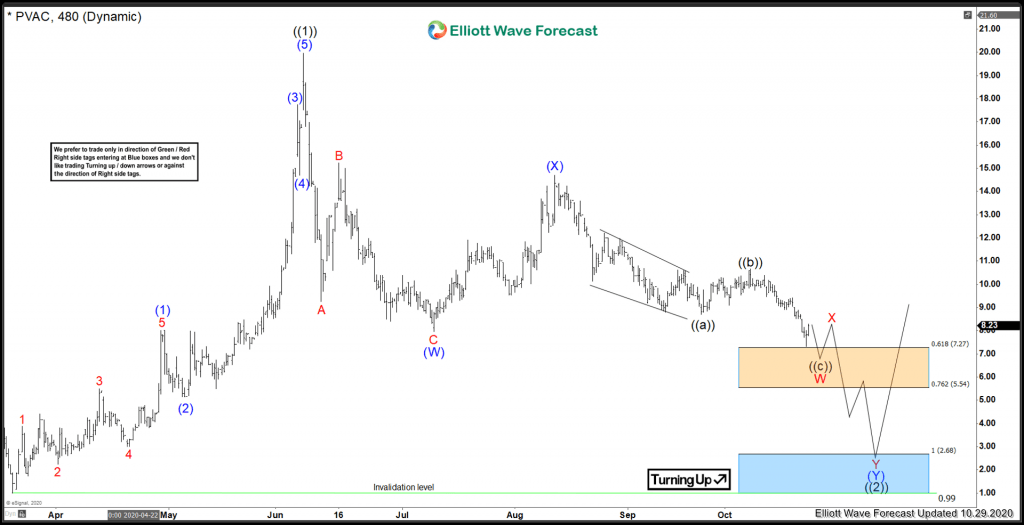
This stock has just recently broke below the July low. This qualifies it as having the minimum number of swings needed to complete this correction. When comparing to the XLE chart below, we can see that XLE is very close to the equal leg extreme area (Blue box). This is an area that can provide a bounce in 3, 7 or 11 swing at least. Why does this matter? Because when XLE reaches that extreme area, it is highly probably that other energy producers are going to bounce along with it. This is why we want to find the strongest charts and trade those ones.
On the Penn Virginia Chart, from the March 2020 low at 0.99, there is a 5 waves advance into black ((1)) which peaked at 19.97 on June 8/2020. That is a staggering 2000% gain in the short span of a few months. From there, the swings are lining up well with the XLE Energy ETF shown below. Penn has an equal leg extreme blue box area of 2.68 to the invalidation level of 0.99. An area where buyers may show up for a bounce in 3 waves at least. But considering the relative strength of this name, it may strike a low when the XLE energy ETF hits its equal leg blue box. It may be the case that Penn strikes a low at the orange area instead, which is the 61.8 to 76.2 fib area extension. As mentioned above, this will depend on when the broad market, XLE, strikes a low. Lets look at the XLE chart.
XLE Energy Producers ETF Elliott wave View
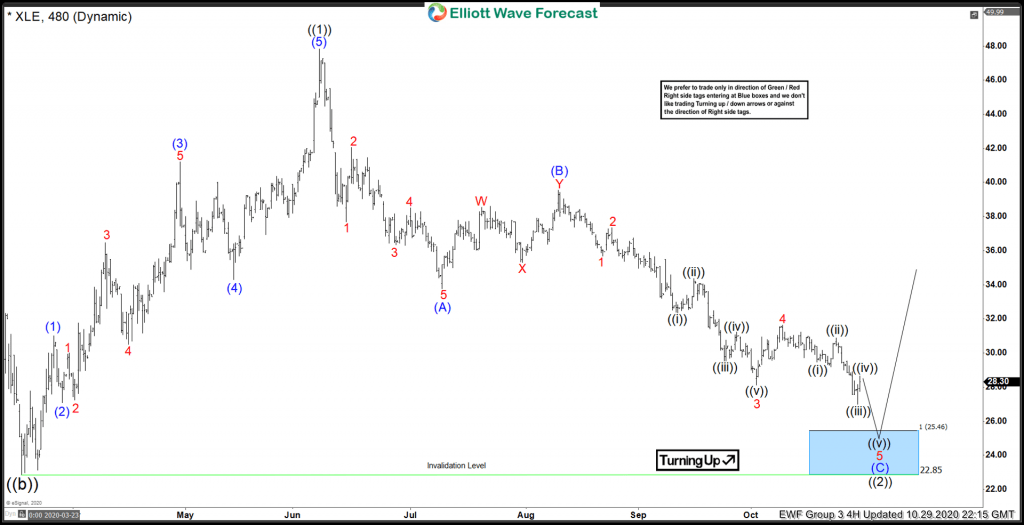
When looking at XLE ETF. We can see that an equal leg extreme 25.46 to invalidation level 22.85 is much closer than the blue box for PVAC. An area to watch for a broad turn in the Energy Producer complex is that blue box extreme on the XLE ETF. If XLE manages to get there, and Penn is at the orange area, Penn may find a low there instead.
In Conclusion. Ideally, the PVAC price will get down to the blue box extreme the same time as the XLE hits the blue box. But considering how far down PVAC would need to travel, this looks unlikely. Watch for clues on how XLE reacts at that area, as for if Penn Virginia can find a low at the 0.618 area instead.
Risk Management
Using proper risk management is absolutely essential when trading or investing in a volatile stocks. Elliott Wave counts can evolve quickly, be sure to have your stops in and define your risk when trading.
Author

Elliott Wave Forecast Team
ElliottWave-Forecast.com


