Peace talks Trump up markets

USD: Dec '25 is Up at 99.160.
Energies: Dec '25 Crude is Down at 57.68.
Financials: The Dec '25 30 Year T-Bond is Higher by 21 ticks and trading at 118.19.
Indices: The Dec '25 S&P 500 emini ES contract is 242 ticks Lower and trading at 6636.00.
Gold: The Dec'25 Gold contract is trading Up at 4149.30.
Initial conclusion
This is not a correlated market. The USD is Up and Crude is Down which is normal, and the 30 Year T-Bond is trading Higher. The Financials should always correlate with the US dollar such that if the dollar is Higher, then the bonds should follow and vice-versa. The S&P is Lower and Crude is trading Lower which is not correlated. Gold is trading Higher which is not correlated with the US dollar trading Up. I tend to believe that Gold has an inverse relationship with the US Dollar as when the US Dollar is down, Gold tends to rise in value and vice-versa. Think of it as a seesaw, when one is up the other should be down. I point this out to you to make you aware that when we don't have a correlated market, it means something is wrong. As traders you need to be aware of this and proceed with your eyes wide open. All of Asia traded Lower with the exception of the Aussie exchange. Currently all of Europe is trading Lower.
Possible challenges to traders
- NFIB Small Business Index is out at 6 AM EST. Major.
- FOMC Member Bowman Speaks at 8:45 AM EST. Major.
- Fed Chair Powell Speaks at 12:20 PM EST. Major.
- FOMC Member Waller Speaks at 3:25 PM EST. Major.
- FOMC Member Collins Speaks at 3:30 PM EST. Major.
Traders, please note that we've changed the Bond instrument from the 10 Year (ZN) to the 2 Year (ZT). They work exactly the same.
We've elected to switch gears a bit and show correlation between the 2-year Treasury notes (ZT) and the S&P futures contract. The YM contract is the Dow Jones Industrial Average, and the purpose is to show reverse correlation between the two instruments. Remember it's likened to a seesaw, when up goes up the other should go down and vice versa.
Yesterday the ZT dived Lower at around 8:30 AM EST with no other economic news in sight. The Dow climbed Higher at the same time. Look at the charts below and you'll see a pattern for both assets. The Dow climbed Higher at around 8:30 AM EST and the ZT dived Lower at around the same time. These charts represent the newest version of Bar Charts, and I've changed the timeframe to a 15-minute chart to display better. This represented a Short opportunity on the 2-year note, as a trader you could have netted about a dozen ticks per contract on this trade. Each tick is worth $6.25. Please note: the front month for ZT is now Dec '25 and the Dow is now Dec '25. I've changed the format to filled Candlesticks (not hollow) such that it may be more apparent and visible.
Charts courtesy of barcharts
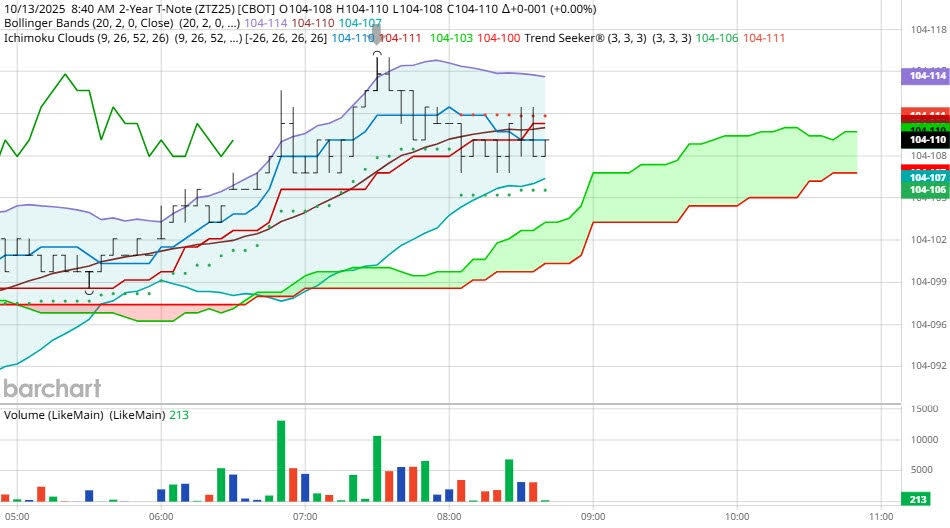
ZT -Sep 25 - 10/13/25

Dow - Sep 2025- 10/13/25
Bias
Yesterday we gave the markets a Neutral bias, but the markets were enthused with peace fever and went Higher. The Dow gained 588 points, and the other indices rose as well. Today we aren't dealing with a correlated market, and our bias is to the Downside.
Could this change? Of Course. Remember anything can happen in a volatile market.
Commentary
It seemed that all the global markets wanted to rise in light of the peace deal consummated in the Middle East. All markets rose by triple digits. Today we have Fed Chair Powell making a speech so perhaps he can help to drive the markets even Higher.
Author

Nick Mastrandrea
Market Tea Leaves


