Payrolls “Unexpectedly” Weak, Negative Revisions, Earning Poor: What Happened?

Initial Reaction
Today’s establishment survey was a much weaker than expected at 138,000 jobs.
The establishment survey was 47,000 under the Econodsay consensus and 115,000 below the ADP projection. ADP was also wildly off the mark in March, estimating 263,000.
March is now revised at 50,000. BLS revisions took away a net 66,000 jobs in March and April.
The household survey was even worse. Employment fell by 233,000.
What Happened?
The roots of this weakness go back to the April report, for March.
I discussed today’s setup on April 7, in Wild Miss in Expected Jobs: Economists Blame the Weather. Here is the pertinent snip.
Today’s employment report shows a wild miss in the expected number of jobs. The Econoday consensus estimate was 175,000 and ADP expected 263,000.
Instead, the BLS reported an increase of 98,000. Economists did what they usually do in such situations: blame the weather.
“Throw ADP out, it was the weather in March! Or at least the Category 3 storm that swept the Northeast may explain a much weaker-than-expected 98,000 increase in March nonfarm payrolls. This compares with Econoday’s consensus for 175,000 and a low estimate of 125,000” says Econoday.
On May 5, (for April Jobs), I reported April Payrolls Bounce, Revisions Take March Lower: Hiring Increasingly Volatile
Today’s establishment employment report shows a huge, 211,000 jump in reported jobs vs a downward revised March. The BLS revised March even lower, to 79,000 from 98,000. Revisions also took February up to 232,000 from 219,000.
Last month, economists blamed the weather. If so, the correct thing to do is average both months as employees not hired in March due to weather would have been hired in April instead.
The two-month average is 145,000 per month. That’s not a disaster, but it’s not particularly strong either.
Revisions
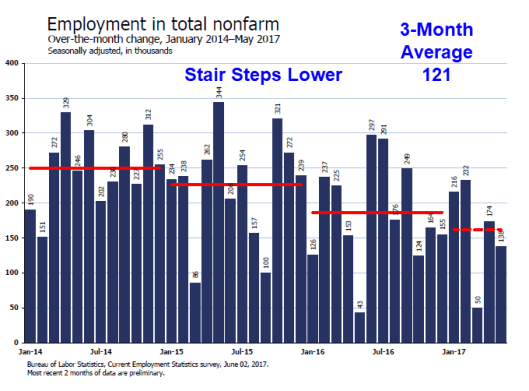
The change in total nonfarm payroll employment for March was revised down from +79,000 to +50,000, and the change for April was revised down from +211,000 to +174,000. With these revisions, employment gains in March and April combined were 66,000 less than previously reported.
Lesson Probably Not Learned
Economists did not average March and April, as I suggested. Perhaps they learned their lesson, but I doubt it.
With revisions this month, March, April, And May now sit at 50,000 jobs, 174,000 jobs, and 138,000 jobs, respectively. That an average of 120,667 jobs a month.
Let’s dive into the details in the BLS Employment Situation Summary, unofficially called the Jobs Report.
BLS Jobs Statistics at a Glance
- Nonfarm Payroll: +138,000 – Establishment Survey
- Employment: -233,000 – Household Survey
- Unemployment: -195,000 – Household Survey
- Involuntary Part-Time Work: -53,000 – Household Survey
- Voluntary Part-Time Work: +320,000 – Household Survey
- Baseline Unemployment Rate: -0.1 to 4.3% – Household Survey
- U-6 unemployment: -0.2 to 8.4% – Household Survey
- Civilian Noninstitutional Population: +179,000
- Civilian Labor Force: -429,000 – Household Survey
- Not in Labor Force: +608,000 – Household Survey
- Participation Rate: -0.2 to 62.7 – Household Survey
Employment Report Statement
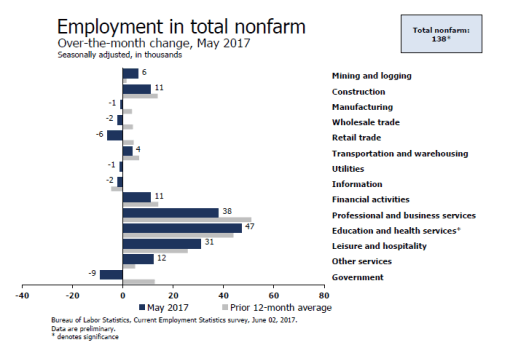
Total nonfarm payroll employment increased by 138,000 in May, and the unemployment rate was little changed at 4.3 percent, the U.S. Bureau of Labor Statistics reported today. Job gains occurred in health care and mining.
Unemployment Rate – Seasonally Adjusted

The above Unemployment Rate Chart is from the BLS. Click on the link for an interactive chart.
Nonfarm Employment Change from Previous Month
Nonfarm Employment Change from Previous Month by Job Type
Hours and Wages
Average weekly hours of all private employees were flat at 34.4 hours. Average weekly hours of all private service-providing employees declined 0.1 hours to 33.2 hours. Average weekly hours of manufacturers were flat at 40.7 hours. All are the same as a year ago.
Average hourly earnings of private workers rose $0.03 to $22.00. Average hourly earnings of private service-providing employees rose $0.04 to $21.79. Average hourly earnings of manufacturers rose $0.02 to $20.79.
For a discussion of income distribution, please see What’s “Really” Behind Gross Inequalities In Income Distribution?
Birth Death Model
Starting January 2014, I dropped the Birth/Death Model charts from this report. For those who follow the numbers, I retain this caution: Do not subtract the reported Birth-Death number from the reported headline number. That approach is statistically invalid. Should anything interesting arise in the Birth/Death numbers, I will comment further.
Table 15 BLS Alternate Measures of Unemployment
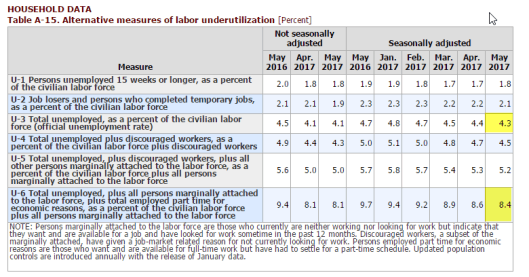
Table A-15 is where one can find a better approximation of what the unemployment rate really is.
Notice I said “better” approximation not to be confused with “good” approximation.
The official unemployment rate is 4.3%. However, if you start counting all the people who want a job but gave up, all the people with part-time jobs that want a full-time job, all the people who dropped off the unemployment rolls because their unemployment benefits ran out, etc., you get a closer picture of what the unemployment rate is. That number is in the last row labeled U-6.
U-6 is much higher at 8.4%. Both numbers would be way higher still, were it not for millions dropping out of the labor force over the past few years.
Some of those dropping out of the labor force retired because they wanted to retire. The rest is disability fraud, forced retirement, discouraged workers, and kids moving back home because they cannot find a job.
Strength is Relative
It’s important to put the jobs numbers into proper perspective.
- In the household survey, if you work as little as 1 hour a week, even selling trinkets on eBay, you are considered employed.
- In the household survey, if you work three part-time jobs, 12 hours each, the BLS considers you a full-time employee.
- In the payroll survey, three part-time jobs count as three jobs. The BLS attempts to factor this in, but they do not weed out duplicate Social Security numbers. The potential for double-counting jobs in the payroll survey is large.
Household Survey vs. Payroll Survey
The payroll survey (sometimes called the establishment survey) is the headline jobs number, generally released the first Friday of every month. It is based on employer reporting.
The household survey is a phone survey conducted by the BLS. It measures unemployment and many other factors.
If you work one hour, you are employed. If you don’t have a job and fail to look for one, you are not considered unemployed, rather, you drop out of the labor force.
Looking for jobs on Monster does not count as “looking for a job”. You need an actual interview or send out a resume.
These distortions artificially lower the unemployment rate, artificially boost full-time employment, and artificially increase the payroll jobs report every month.
Final Thoughts
Here’s a recap of my final thoughts from last month.
It is difficult to know how best to treat March. If a snowstorm on the East coast disrupted counting in March, then the bounce back today should have been stronger than it was.
If March was just a random fluctuation, then averaging over three or four months might be the correct procedure.
Either way, the second chart shows this is not 2014. Hiring has slowed and is increasingly volatile as well.
The trend to slower and slower hiring is now obvious. The three-month trend is even worse. With home sales weakening, construction spending weakening, auto sales weakening there is no reason to believe hiring is about to soar.
Signs of a weakening economy are nearly everywhere except some soft-data diffusion indexes.
Author

Mike “Mish” Shedlock's
Sitka Pacific Capital Management,Llc


