Patterns: GBR.IDX/GBP, DOLLAR.IDX/USD, USD/NOK, EUR/NOK
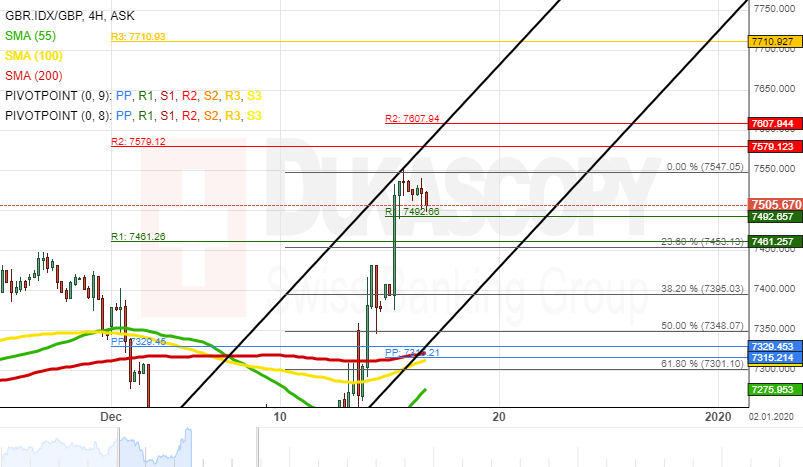
GBR.IDX/GBP 4H Chart: Could make pullback
During the past week, the UK 100 has appreciated by 5.57% in value. The price breached a swing higher at 7442.2 on December 16. Currently, the pair is trading in a narrow ascending channel pattern.
All things being equal, the GBR.IDX/GBP pair could make a brief retracement down towards the 50.00% Fibonacci retracement level at 7329.4 within this week's trading sessions.
However, technical indicators demonstrate that the UK 100 index will likely continue to trading in the ascending channel pattern during the following trading sessions.
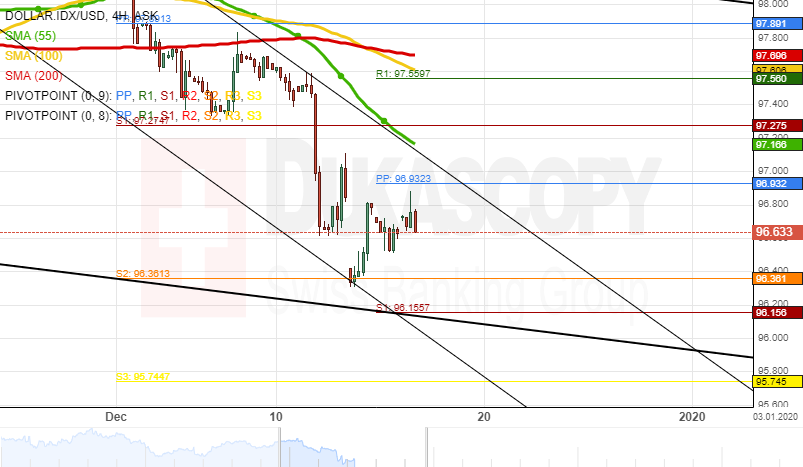
DOLLAR.IDX/USD 4H Chart: Likely to maintain channel
The dollar index, which measures the US Dollar against a basket of major currencies has been depreciating in a descending channel pattern since the beginning of December. The currency pair has declined by 2.15% in value during this past two weeks.
Everything being equal, the Dollar.IDX/USD pair will most likely maintain the descending channel within this week's trading sessions. The potential target will be at the 95.74 area.
However, a support cluster formed by the weekly S1 and the monthly S2 near the 96.25 zones could provide support for the pair during the following trading sessions.
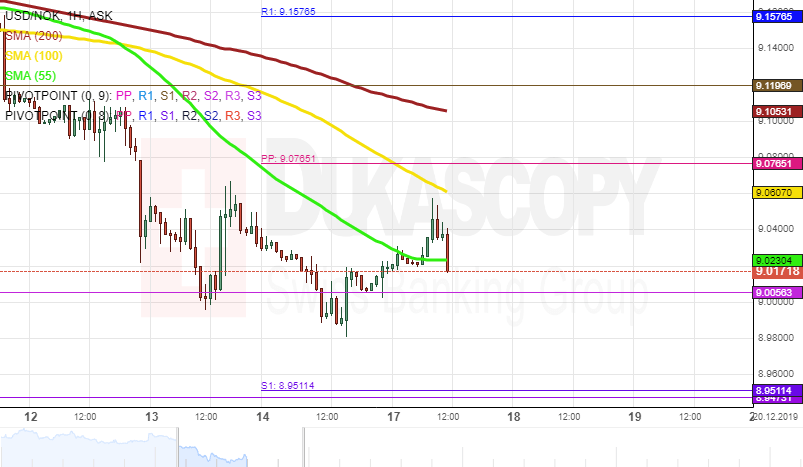
USD/NOK 1H Chart: Pair is likely to decline
The US Dollar has been depreciating against the Norwegian Krone since the beginning of last week after the USD/NOK exchange rate failed to surpass the resistance level formed by the monthly PP at 9.1780.
Note that the currency pair is pressured by the 55-, 100– and 200-hour moving averages, currently located in the 9.0491/9.1238 area. Thus, it is likely that bears could continue to prevail in the market in the short run.
The exchange rate is likely to target the support level formed by the Fibonacci 23.60% retracement at 8.8849. If the given level holds, the rate could reverse upwards in the medium term. Otherwise, some downside potential could continue to prevail in the market, and the rate could target the Fibonacci 38.205 retracement at 8.6461.
EUR/NOK 1H Chart: Short-term decline expected
The Euro has been depreciating against the Norwegian Krone since last Tuesday after the EUR/NOK currency pair failed to exceed the 10.20 level.
Note that the exchange rate is pressured by the 55-, 100– and 200-hour moving averages, currently located in the 10.09/10.14 area. Thus, it is likely that some downside potential could continue to prevail in the market.
The currency pair could reach the support level formed by the Fibonacci 23.605 retracement at 9.94. If the given level holds, a reversal north could follow. Otherwise, the pair could surpass the psychological level at 9.85.
Author

Dukascopy Bank Team
Dukascopy Bank SA
Dukascopy Bank stands as an innovative Swiss online banking institution, with its headquarters situated in Geneva, Switzerland.


