Patterns: EUR/SGD, CHF/SGD, GBP/CAD, GBP/AUD
EUR/SGD 1H Chart: Downside potential could prevail
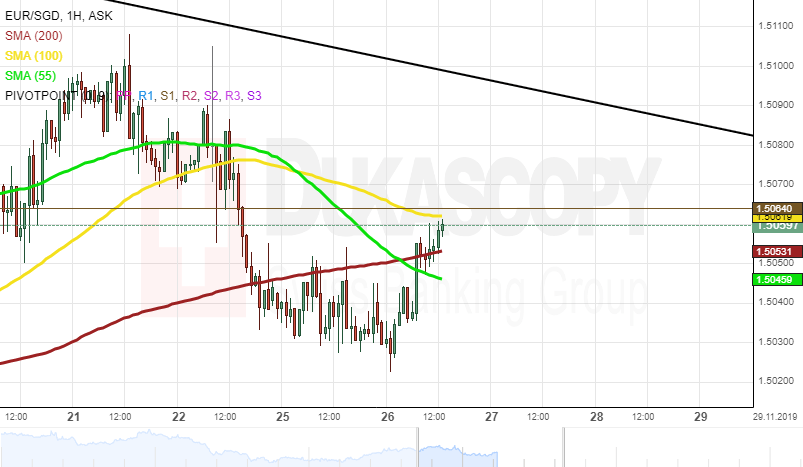
The Euro has been depreciating against the Singapore Dollar since the middle of October. This movement has been bounded within the medium-term descending channel.
As apparent on the chart, the EUR/SGD currency pair has already reversed south from the upper channel line at 1.5100. From a theoretical point of view, it is likely that some downside potential could prevail in the market, and the pair could reach the lower channel line located in the 1.4880/1.4920 area.
If the given channel holds, it is likely that the Euro could continue to depreciate against the Greenback in the medium term. However, note that the exchange rate could gain support from the monthly S2 and S3, located at 1.4953 and 1.4851 respectively.
CHF/SGD 1H Chart: Ascending triangle pattern in sight
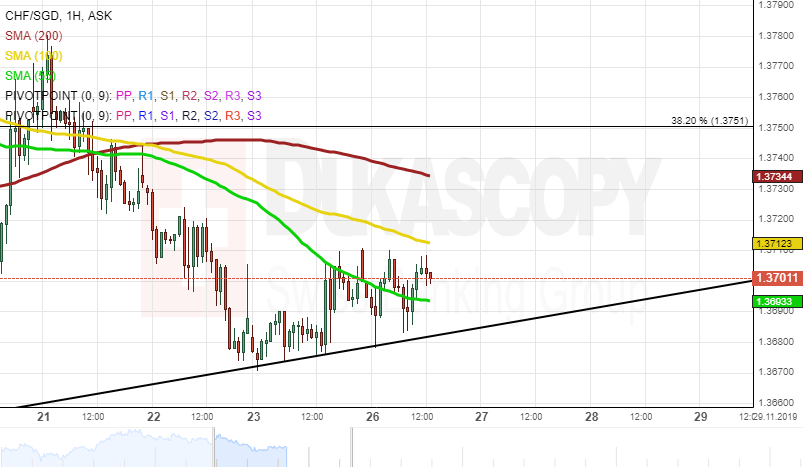
The CHF/SGD currency pair has been trading within the ascending triangle pattern since the beginning of November.
Currently, the exchange rate is testing the lower pattern line located at 1.3680. From a theoretical point of view, it is likely that a reversal north could occur in the nearest future, and the rate could reach the upper triangle line at 1.3800. Also, from a theoretical perspective, it is likely that a breakout north could occur in the medium term. Important level to look out for is the Fibo 50.00% at 1.3886.
However, note that the pair is pressured by the 55-, 100– and 200-hour SMAs. Therefore, if the given pattern does not hold, a breakout south could occur within the following trading sessions. In this case, the rate could decline to the Fibo 23.60% at 1.3583.
GBP/CAD 4H Chart: Guided by 100– hour SMA
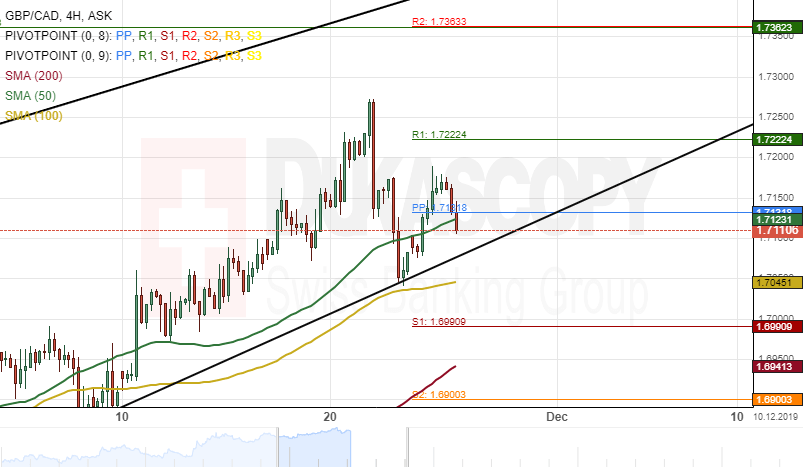
The British Pound has been appreciating in an ascending channel pattern against the Canadian Dollar since the beginning of September. The currency pair has appreciated about 7.97% in value during the past three months.
As for the near future, the GBP/CAD exchange rate will most likely continue to appreciate in the channel pattern. The potential target for bullish traders would be at a resistance cluster formed by the monthly R1 and the weekly R2 near the 1.7362 area.
Furthermore, technical indicators suggest that the currency exchange rate will continue its bullish movement in the nearest future.
GBP/AUD 4H Chart: Bullish signals
Since November 6, the Pound Sterling has appreciated about 2.58% in value against the Australian Dollar. The currency pair tested October's swing high at 1.9073 during last week's trading session.
All things being equal, the GBP/AUD exchange rate will most likely continue to edge higher until it reaches the upper boundary of a junior ascending channel pattern at 1.9434.
If the junior ascending channel holds, the currency exchange rate will make a brief downside retracement in the short-term future.
In the meantime, technical indicators demonstrate that bullish traders would continue to dominate the pair during the following trading sessions.

Author

Dukascopy Bank Team
Dukascopy Bank SA
Dukascopy Bank stands as an innovative Swiss online banking institution, with its headquarters situated in Geneva, Switzerland.


