Patterns: DOLLAR.IDX/USD, GBR.IDX/GBP, USD/ILS, USD/MXN
DOLLAR.IDX/USD 4H Chart: Sets for breakout
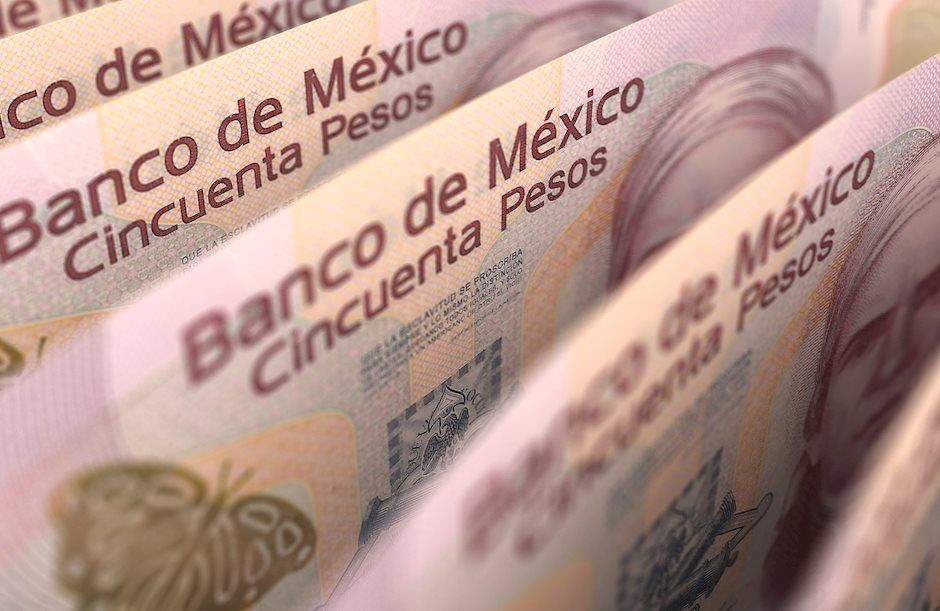
The dollar index, which measures the US Dollar against a basket of major currencies, has been depreciating in a descending channel pattern since the beginning of October. The pair has declined about 2.29% in value during this period.
The Dollar.IDX/USD pair is currently trading near the upper boundary of the descending channel pattern at 97.47.
All things being equal, a breakout could occur within this week's trading sessions. The possible target will be at the 98.38 area.
However, from a theoretical point of view, it is expected the pair makes a brief retracement down during the coming days.
GBR.IDX/GBP 4H Chart: Bullish momentum to continue
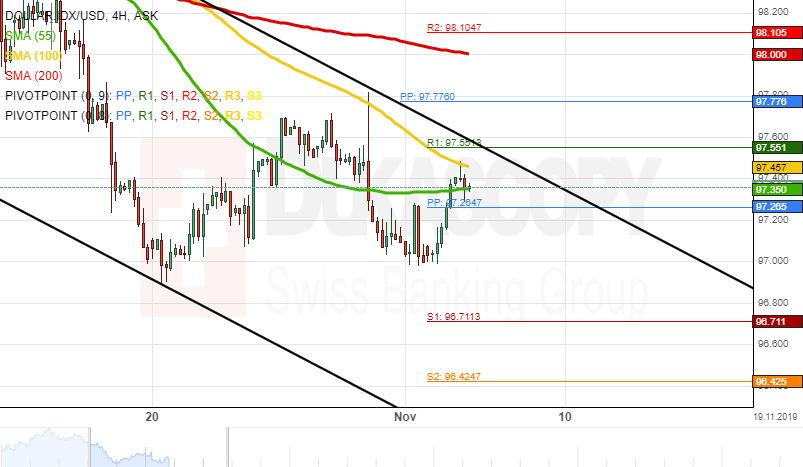
The GBR.IDX/GBP has been trading in a junior ascending channel pattern since the beginning of October. The pair has appreciated about 5.26% in value during this period.
The UK100 is currently trading near a resistance cluster formed by the weekly R2 and the upper boundary of the junior ascending channel at 7406.61.
If the resistance cluster holds, a decline towards the 55– hour simple moving average at 7300.23 could occur within this week's sessions.
However, if the pair breaks the resistance level, bullish traders might drive the price towards a psychological level at 7600.00 in the nearest future.
USD/ILS 1H Chart: Bulls could prevail
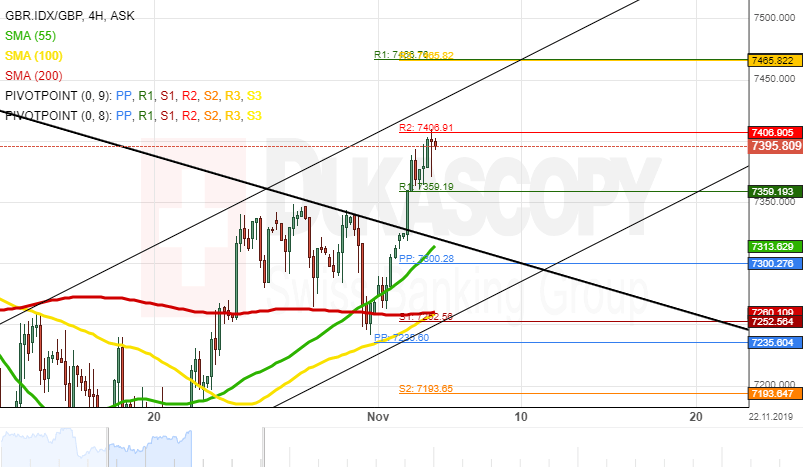
The US Dollar has been appreciating against the Israeli Shekel since the beginning of October when the USD/ILS currency pair reversed north from the lower boundary of the long-term ascending channel (4H time-frame chart).
From a theoretical point of view, it is likely that some upside potential could prevail in the market, as the exchange rate should reach the upper channel line located circa 3.5600/3.5700. In this case the rate would have to surpass the resistance level formed by the Fibo 50.00% at 3.5565.
However, note that the currency pair is pressured by the 55-, 100- and 200-hour moving averages. Therefore, the possible advance might not be immediate, and the pair could re-test the lower channel line.
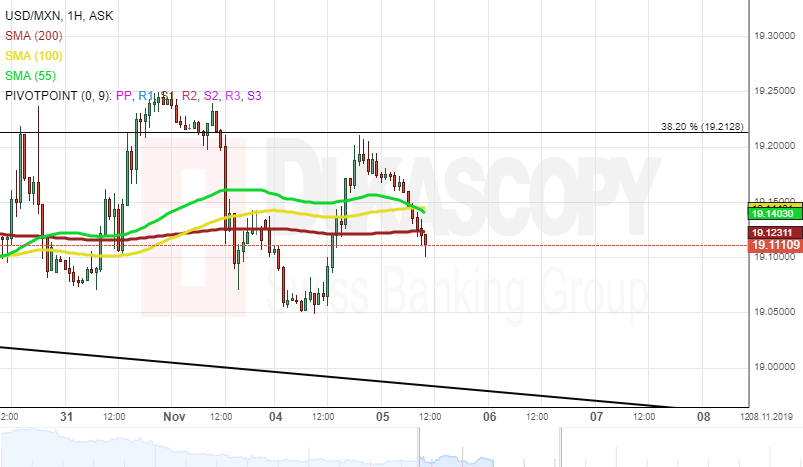
USD/MXN 1H Chart: Short-term advance expected
The US Dollar has been depreciating against the Mexican Peso since the beginning of September. This movement has been bounded within the falling wedge pattern.
As apparent on the chart, the USD/MXN currency pair has already reversed north from the lower pattern line. Thus it is likely that some upside potential could prevail in the market in the short run. A possible upside target is the upper pattern line located in the 19.20/19.40.
If the given pattern does not hold, bulls could prevail in the market in the medium term. The exchange rate could target the resistance level formed by the Fibo 50.00% at 19.75. Otherwise, the Greenback could continue to depreciate within the given pattern in the medium term.
Author

Dukascopy Bank Team
Dukascopy Bank SA
Dukascopy Bank stands as an innovative Swiss online banking institution, with its headquarters situated in Geneva, Switzerland.


