Patterns: Copper, Ethereum

Copper ends sideways trading
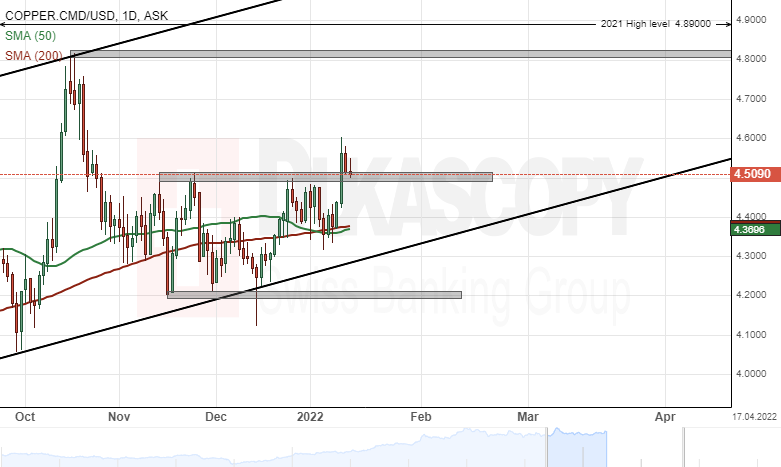
Despite piercing the support of the lower trend line of the channel up pattern and the November and December low levels, the price for copper recovered during the same session on December 15. Afterwards, the price started to find support in the channel pattern, before starting a surge. The following surge tested the November high zone for half-a-month. On January 12, the high level zone was passed. On January 15, the previous resistance was providing support.
In theory, the price should surge. A potential surge of the commodity would face resistance in round price levels as the 4.6000 and 4.7000, before the price reaches the October high levels above the 4.8000 mark. Above these levels, note the 2021 high level at 4.8900.
On the other hand, a decline would have to pass the November high level zone at 4.4913/4.5140. Below the zone, the price could find support in the combination of the 50 and 200-day simple moving averages near 4.3700. Further below, the lower trend line of the channel up pattern, which has guided the rate since June.
Ethereum faces resistance
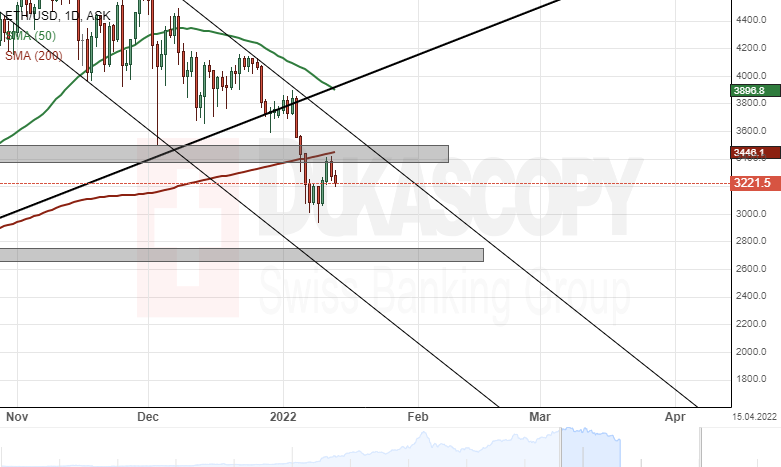
Since the last review, the price for Ethereum has broken the wide channel up pattern that guided the price since June. The breaking was followed by a decline below the December and mid-October low level zone at 3,383.00/3,500.00.
In early January, the pair passed the support of the zone and the 200-day simple moving average and declined to the 3,000.00 mark. Most recently, the currency rate recovered and began to test the 3,383.00/3,500.00 zone and the 200-day SMA. Meanwhile, it was spotted that Ethereum had been declining in a channel down pattern since early November.
If the rate passes the resistance zone and the 3,500.00 level, it would face the upper trend line of the channel down pattern near 3,600.00. Higher above, the 50-day simple moving average might act as resistance near 3,900.00. In the case that all of these resistance levels are passed, the cryptocurrency would have no resistance as high as the all-time-high level zone at 4,775.00/4,865.00.
However, a bounce off from the resistance zone would look for support in the 3,000.00 mark. Below 3,000.00, the September low level zone at 2,660.00/2,750.00 could stop a decline.
Author

Dukascopy Bank Team
Dukascopy Bank SA
Dukascopy Bank stands as an innovative Swiss online banking institution, with its headquarters situated in Geneva, Switzerland.


