Pandemic low of $1.0638 eyed as resistance on EUR/USD

EUR/USD
EUR/USD bulls entered an offensive phase on Thursday amidst broad USD softness. The US Dollar Index (USDX) plunged 1 per cent by the close of Europe, driven lower by US Treasury yields navigating south across the curve.
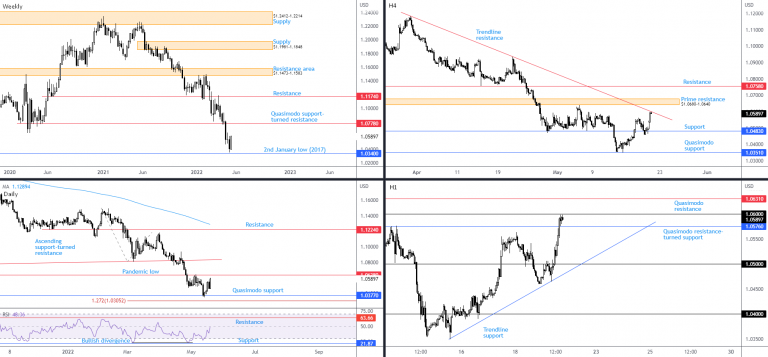
Evident from the weekly timeframe, EUR/USD buyers remain in the driving seat and are on track to form a textbook bullish engulfing candle ahead of 2nd January low at $1.0340 (2017). Overhead, Quasimodo support-turned resistance at $1.0778 is visible on the weekly scale, which if tested could be a reasonable platform for a ‘sell-on-rally’ theme, in a market decisively trending lower since 2021.
Lower on the curve, however, the daily timeframe reveals price is closing in on the underside of the pandemic low of $1.0638 (March 2020), a level that served as firm resistance at the beginning of May. Quasimodo support coming in at $1.0377 is seen to the downside, closely shadowed by a 1.272% Fibonacci projection at $1.0305. Adding to the daily timeframe’s technical landscape, the relative strength index (RSI) is seen closing in on the lower side of the 50.00 centreline.
Of technical relevance on the H4 timeframe, trendline resistance (taken from the high $1.1185) is now active, following an earlier retest of support at $1.0483. Overcoming the said trendline resistance shines light on H4 prime resistance at $1.0680-1.0640, which happens to reside 2 pips north of daily resistance mentioned above at $1.0638. Analysis based on the H1 timeframe has price within reach of $1.06 after rebounding from nearby Quasimodo resistance-turned support at $1.0576. Upstream, H1 Quasimodo resistance can be seen as the next upside target at $1.0631, a base sharing chart space with daily resistance at $1.0638.
Technical outlook
Technical elements in this market show a clear downtrend present, with the daily RSI possibly testing 50.00 as resistance. This draws attention to the daily timeframe’s resistance at $1.0638, together with H1 Quasimodo resistance at $1.0631 and H4 prime resistance at $1.0680-1.0640 as a possible zone that sellers could emerge from.
AUD/USD
The Australian dollar outperformed against the US dollar on Thursday, adding 1.5 per cent and reclaiming Wednesday’s losses.
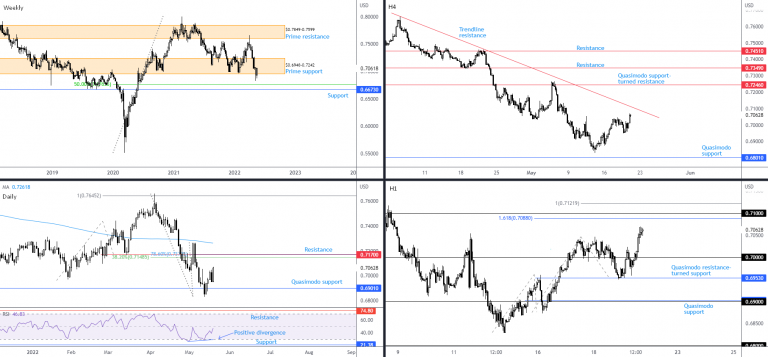
Price action on the weekly chart is threatening to engulf prime support at $0.6948-0.7242. This, in a market demonstrating a downside bias since early 2021, and daily action trading under its 200-day simple moving average at $0.7262 since 21st April, unearths weekly support at $0.6673 and a neighbouring 50.0% retracement at $0.6764.
Quasimodo support at $0.6901 on the daily timeframe remains in place. Upstream casts light on resistance at $0.7170, which happens to accommodate a 78.6% Fibonacci retracement at $0.7174 and a 38.2% Fibonacci retracement at $0.7149. Joining current resistances is the relative strength index (RSI); the indicator is poised to retest the lower side of the 50.00 centreline, following positive divergence ahead of support at 21.38.
Out of the H4 timeframe, movement is within range of trendline resistance, extended from the high $0.7661. Interestingly, just above this descending line resides the daily resistances. However, on the H1 timeframe, price is eyeballing $0.71 as possible resistance (joined by a 1.618% Fibonacci projection at $0.7088 and a 100% Fibonacci projection at $0.7122), which merges with current H4 trendline resistance.
Technical outlook
Despite recent buying, this remains a sellers’ market.
Immediate resistance is present around $0.71 (enclosed between H1 Fibonacci resistances at $0.7122-0.7088) on the H1, aided by H4 trendline resistance. Failure to attract sellers could unlock a whipsaw to daily resistances around $0.7170ish.
USD/JPY
Thursday watched the USD/JPY exchange rate refresh month-to-date lows, as markets largely continued to echo a risk-off tone.
Higher timeframe technical structure remains unchanged on the weekly and daily timeframes; here’s where the research team left the charts in Thursday’s technical briefing:
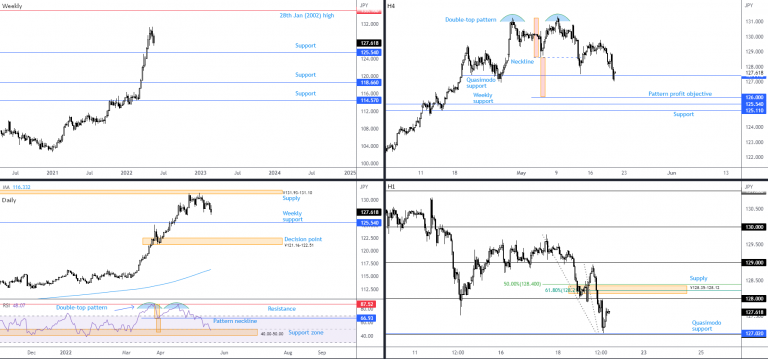
Buyers have been on the ropes since price action made contact with supply at ¥131.93-131.10 on the daily timeframe, in the shape of a shooting star candlestick pattern. The obvious downside objective resides at ¥125.54, a weekly resistance-turned support level. To the upside on the weekly scale, 28th January high (2002) is evident at ¥135.16.
Another key note on the daily scale is the relative strength index (RSI) departing from overbought territory and subsequently breaching a double-top pattern’s neckline stationed around the 66.93 31st March low (peaks were established from indicator resistance at 87.52). Familiar indicator support is now active at 40.00-50.00 (a temporary oversold zone since May 2021) which holds the double-top profit objective within at 45.93.
Focus remains directed towards the double-top formation at ¥131.26 on the H4 chart, displaying a neckline at ¥128.62 which, as you can see, ceded position on 12th May. Should Quasimodo support from ¥127.44 break, the pattern’s profit objective demands attention at ¥126.00, placed a touch north of the weekly support level underlined above at ¥125.54. Elsewhere on the H1 timeframe, a near-test of Quasimodo support at ¥127.02 (and ¥127) materialised in recent trading, a move highlighting ¥128 and neighbouring supply at ¥128.35-128.12 (accompanied by a 50% retracement at ¥128.40 and a 61.8% Fibonacci retracement at ¥128.21).
Technical outlook
Scope to discover deeper water on weekly and daily timeframes, in addition to H4 price on the verge of dethroning Quasimodo support from ¥127.44, a test of H1 supply at ¥128.35-128.12 may be an area sellers draw to. Note that this zone is positioned directly above ¥128, therefore also marking the possibility of a ‘stop-run’.
GBP/USD
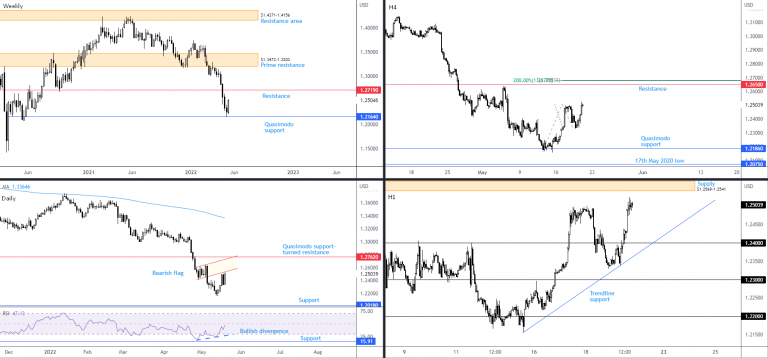
In spite of Wednesday’s deterioration, Thursday staged an impressive rebound and elevated GBP/USD higher by 1.3 per cent. Week to date, the currency pair is higher by 2 per cent, following last week’s pip-perfect test of Quasimodo support at $1.2164 on the weekly timeframe. However, it’s important to remain aware that this market has been entrenched within a strong downtrend since early 2021, emphasising weekly resistance at $1.2719 as a possible ceiling should price test this base.
The technical perspective on the daily timeframe has price bordering on the lower side of a bearish flag pattern formed in early May, made up between $1.2411 and $1.2614. Beyond here, a Quasimodo support-turned resistance is seen around $1.2762, whereas additional weakness draws attention to support from $1.2018. In terms of the daily timeframe’s relative strength index (RSI), bullish divergence recently took hold with the indicator poised to retest the underside of the 50.00 centreline. Bear in mind, however, that the RSI can register oversold signals for extended periods in a downward facing market.
Coming from the H4 timeframe, resistance is likely on the radar at $1.2650 due to the level being accompanied by a 100% Fibonacci projection at $1.2683 and a 200% Fibonacci extension at $1.2677. Harmonic traders will acknowledge the 100% Fibonacci projection represents an AB=CD bearish formation. Key levels on the H1 timeframe right now, though, are supply at $1.2569-1.2541, followed by $1.26. Trendline support is visible to the downside, extended from the low $1.2156.
Technical outlook
The combination of the lower side of the daily bearish flag and H1 supply at $1.2569-1.2541 could be enough to tempt a technical bearish showing.
H1 trendline support is also likely to be of interest if price pulls lower, as both weekly and H4 timeframes demonstrate room to explore higher levels.
Author

Aaron Hill
FP Markets
After completing his Bachelor’s degree in English and Creative Writing in the UK, and subsequently spending a handful of years teaching English as a foreign language teacher around Asia, Aaron was introduced to financial trading,


