One chart reveals how rising interest rate affects your investment [Video]
![One chart reveals how rising interest rate affects your investment [Video]](https://editorial.fxstreet.com/images/Macroeconomics/CentralBanks/InterestRate/interest-rates-gm185083556-19065788_XtraLarge.jpg)
Despite all the 4 major US indices dropped in the past one week, Russell 2000 was the strongest among the 4, where it only dropped -0.37% while Nasdaq 100 dropped 3.6%, S&P 500 dropped 2.3% and the Dow Jones dropped 1.5%.
This simply shows outperformance of the small-cap stocks (Russell 2000) over the other indices.
Below is the most interesting chart for last week since the sharp rising interest rate (as shown in the upper pane) triggered more weakness for the market, especially the Nasdaq 100 and the S&P 500.
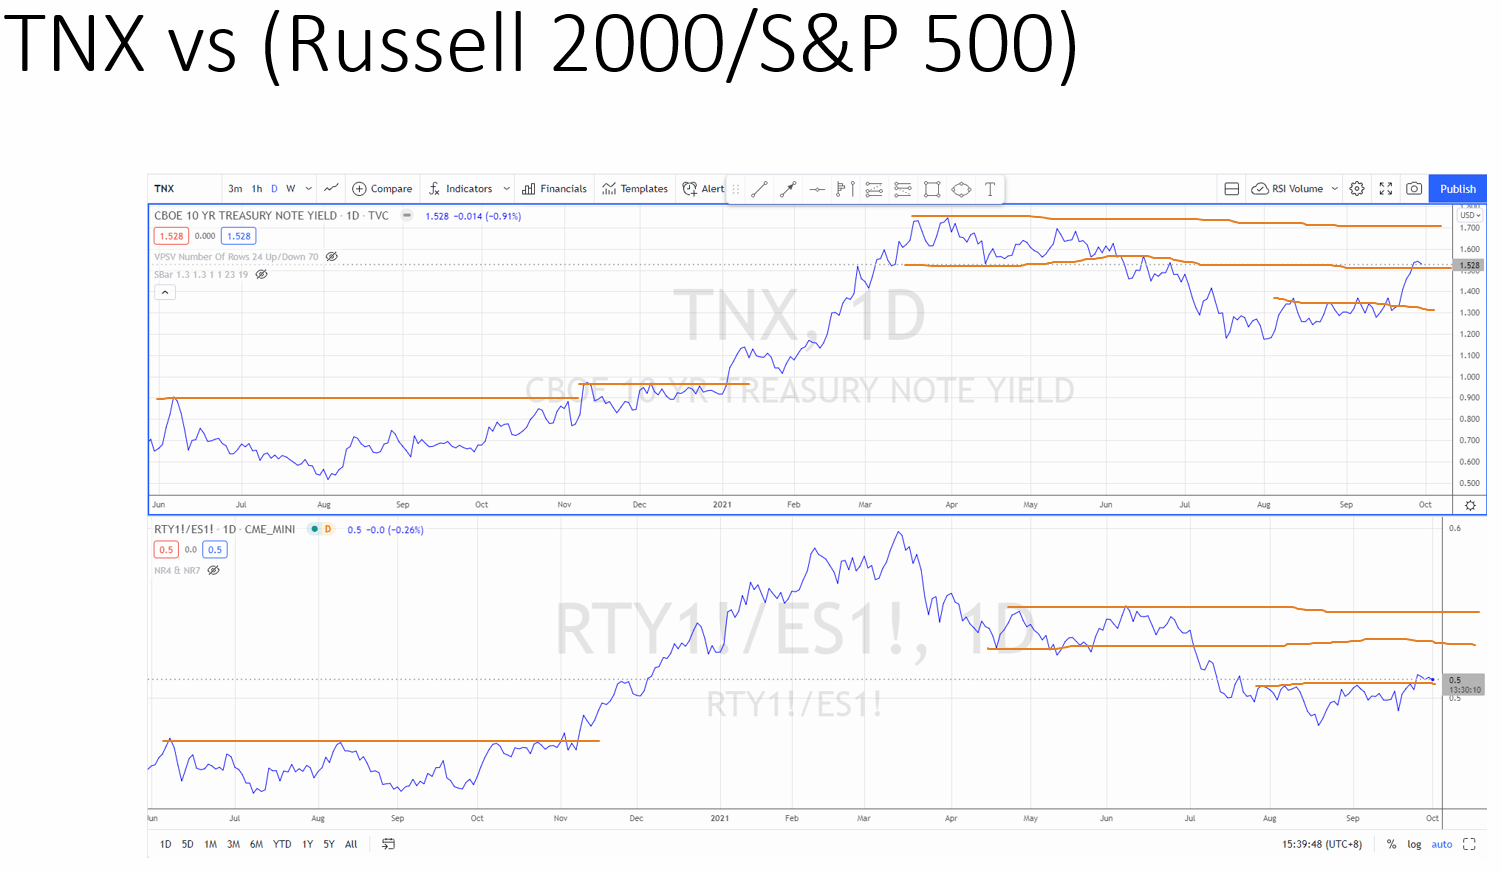
After a spectacular run up of the 10 year treasury yield (TNX) from 1–1.7 in Jan-Mar 2021, it slowly came down to consolidate between 1.2–1.3 and last week had a breakout from the Wyckoff accumulation range and spiked to 1.5.
The chart above compares the 10 year treasury yield (TNX) with the ratio chart (Russell 2000/S&P 500).
How to read the ratio chart (Russell 2000 / S&P 500)
The ratio chart (Russell 2000/S&P 500) compares the 2 indices. During a rising trend, Russell 2000 outperforms S&P 500 and vice versa. The ratio chart works in both bullish and bearish market.
In a bullish market, the outperformance means Russell 2000 rises more than the S&P 500 while in a bearish market (where both indices are in a correction and falling) the outperformance could mean Russell 2000 drops less than the S&P 500.
Relationship between 10 year yield and the ratio chart
Back to the chart above, we can notice that since at least a year ago, while the 10-year yield is trending up, the ratio chart (Russell 2000/S&P 500) is also trending up. This is especially obvious from Nov 2020 till Mar 2021.
This means when the interest rate is rising, there is a rotation from S&P 500 into the Russell 2000 hence the Russell 2000 outperforms the S&P 500 because the smart money took profit from the big/mega cap stocks and rotated into the small-cap stocks where a lot of them are undervalued and/or underperformed.
Since Mar 2021, the 10-year yield has been gradually coming down while the ratio chart (Russell 2000/S&P 500) is trending down too.
This means that when the interest rate is coming down, the S&P 500 starts to outperform the Russell 2000 because the smart money took profit from the small-cap stocks (after a significant run up) and rotated back into the big/mega cap stocks.
This is the short version of how the rotation is played out. Of course, within the index (no matter the Russell 2000, or S&P 500), there will be sector/industry group rotations going on from time to time.
What’s happening now?
As the 10-year yield is rising, we are witnessing an on-going rotation from the big/mega cap (including Nasdaq 100) into the small cap stocks (Russell 2000). Russell 2000 has showed outperformance since Aug 2021.
I anticipate a potential trading range formed for S&P 500 and the Nasdaq 100 while Russell 2000 is to breakout of the existing range, as shown below:

So it is essential to analyze your portfolio and see if you need to adjust your holdings to exit those underperform and re-balance with the outperforming stocks so that you will always beat the market.
Of course portfolio re-balancing is highly dependent on your trading/investing strategies, holding duration and risk profile. Maybe time for a reflection?
Meanwhile check out the video below to find out why now could be the best time to invest in Silver:
Author

Ming Jong Tey
Independent Analyst
Ming Jong Tey has been trading since 2008. He started his learning journey from technical analysis (indicators, Fibonacci, etc...) to value investing. Throughout his journey, he develops an interest in price action with chart pattern trading.


