Oil surged amid falling US inventories, hitting our target

Oil prices rose to their highest level in two months as U.S. inventories fell more than twice what was expected. Where will it lead us?
Trading position
We took the position in the forecasted $67.53-67.94 key support zone, and some partial profits were saved by our suggested stop-win at $68.82 last week. However, what’s the most important: the main target that we expected in our previous editions of Oil Trading Alerts at $72.30 was finally reached yesterday!
Market analysis
U.S. crude inventories for the past week fell 6.4 million barrels (Mb), more than double what analysts had expected (2.7). Gasoline reserves have fallen by 1.9 million barrels, against 3.3 million expected. Notably, strategic crude oil reserves have also declined, by 500,000 barrels.
This phenomenon could be explained by the maintenance of a high level of exports despite the impact on production of the passage of Hurricane Ida in the Gulf of Mexico.
Exports have indeed increased compared to the previous week and are now higher than those of the same period last year.
As a consequence of Hurricane Ida, many companies had to suspend the activity of their rigs in the Gulf of Mexico, as well as of several refineries in Louisiana, also hit by the extreme climatic episode.
As a result, gasoline deliveries remain below their level of last year, even taking into account the drop in demand linked to the end of the summer period, with cooler temperatures.
Our view now is that we could see a pullback to previous supports, either $70.61 (which wouldn’t be the best entry from the risk-to-reward point of view) or $69.39 (which would be preferable). This retracement could either happen (Fig.1):
-
Sraightaway, which would confirm a long-term bearish trend configuration by failing to break higher, above the $73.52 and $74.77 highs (the next resistance levels). Therefore, the market would be topping at a lower high (as defined by the Dow Theory) [scenario A].
-
Once the auctioneers push the prices higher (at least above $73.52) – this scenario would redefine a new long-term bullish trend (with higher highs) [scenario B].
Given the recent market developments, the weekly chart (Fig.2) shows a bullish engulfing candle that could eventually confirm the continuation of a bullish trend.
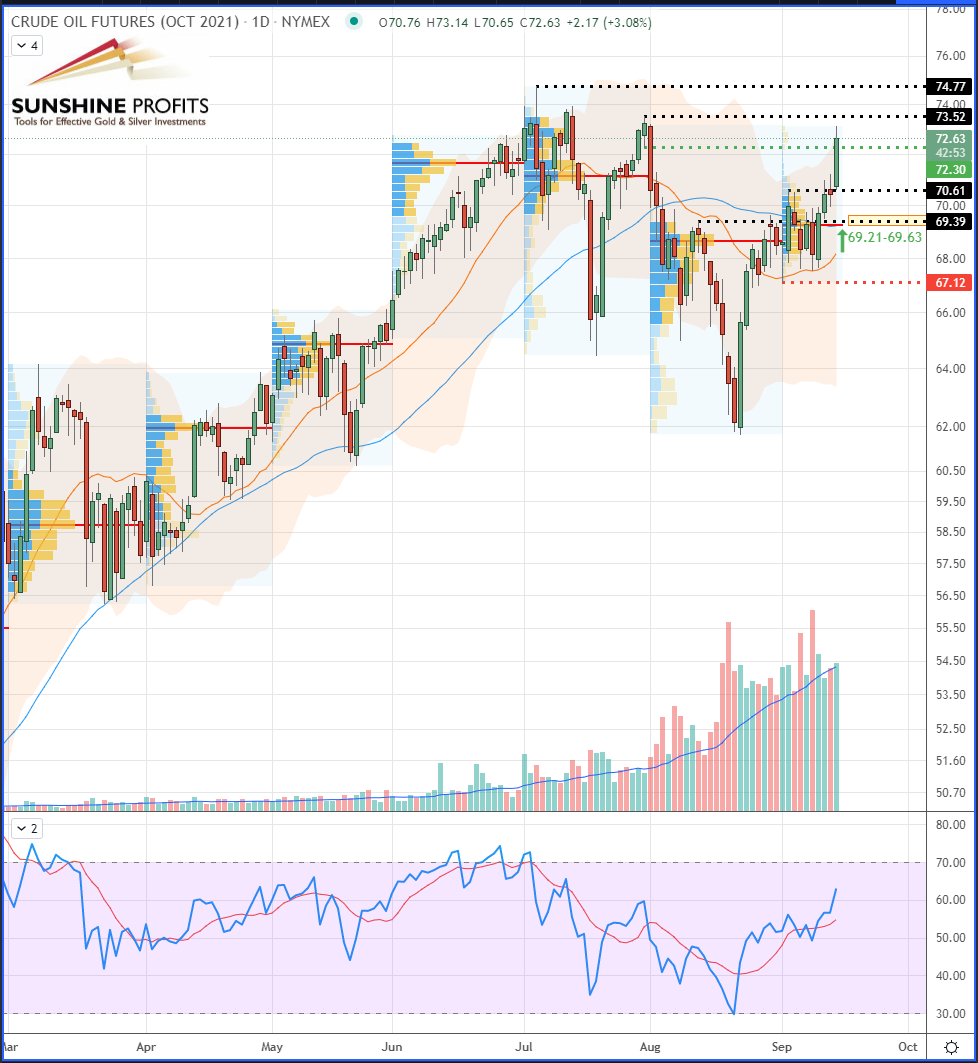
Figure 1 – WTI Crude Oil (CLV21) Futures (October contract, daily).
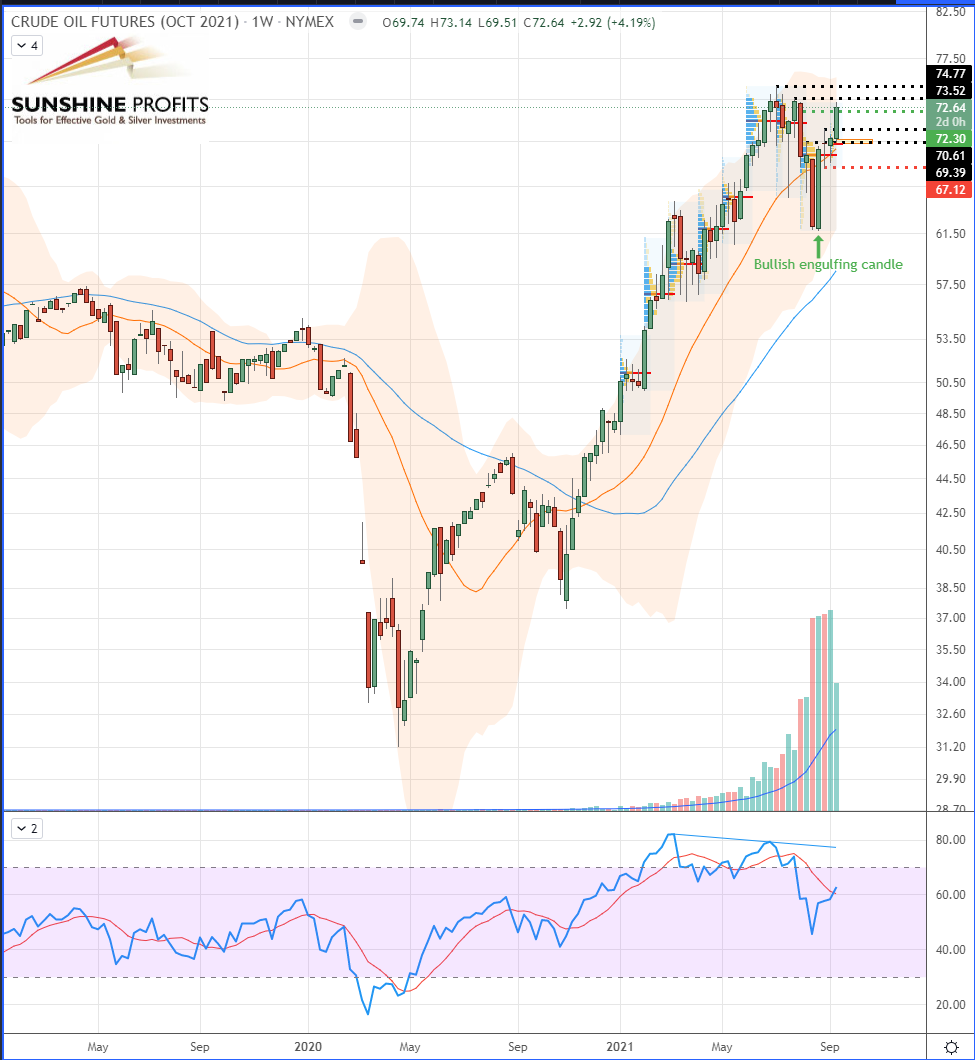
Figure 2 – WTI Crude Oil (CLV21) Futures (October contract, weeky).
In summary, our trading plan on crude oil relies on various scenarios that we have described. For now, in order to see a clearer market picture, we will wait for confirmation. However, as always, we provide you with a pre- defined position that will (or not) be executed, depending on the next price action and oil supply/demand.
Want free follow-ups to the above article and details not available to 99%+ investors? Sign up to our free newsletter today!
Want free follow-ups to the above article and details not available to 99%+ investors? Sign up to our free newsletter today!
Author

Sébastien Bischeri
Sunshine Profits
Sebastien Bischeri is a former Reserve Officer in the French Armed Forces (Navy), and began his career in computer science and engineering, prior to move into banking, finance, and trading.


