Oil refuses to calm down: Markets trade geopolitics while demand sends mixed signals


The old playbook would have been simple: trouble in the Middle East, buy gold, wait for the fear trade to settle in. That is not quite how 2026 has traded. Gold still has buyers, but crude has been the cleaner read on the Iran story and the risk around the Strait of Hormuz.
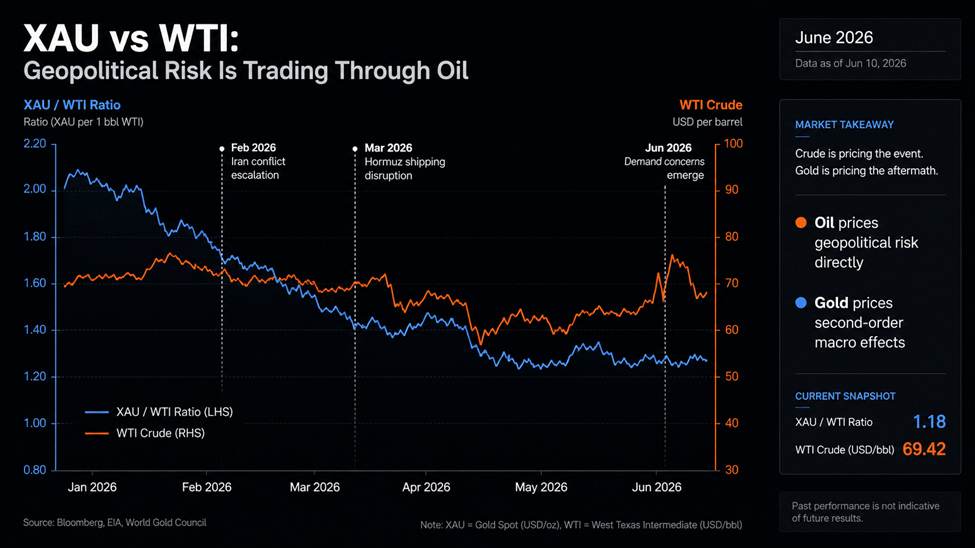
That is the useful part of the gold vs. oil setup. The market is not ignoring geopolitical risk. It is choosing the asset with the shorter transmission line. Right now, that is oil.
Oil has the cleaner link to the crisis
The Iran conflict oil market trade starts with geography, not sentiment. The Strait of Hormuz is narrow, heavily watched, and hard to replace. In normal conditions, it carries roughly one-fifth of global petroleum liquid consumption, so the Strait of Hormuz impact on oil is not an abstract macro theme. It is barrels, tankers, insurance, refinery scheduling, and freight.
Once that route looks less reliable, the repricing starts quickly. Some traders pay more for near-term barrels. Refiners check whether cargo timing still works. Insurers raise questions that commodity desks cannot ignore. That is why oil price geopolitical risk can stay in the price even after the first spike fades.
The demand side is not giving oil bulls a clean story either. In its latest EIA Short-Term Energy Outlook, the agency expects global oil demand to fall by 1.1 million barrels per day in 2026. Earlier in the year, the same broad outlook still pointed to growth. Expensive fuel, limited availability, and policy responses are starting to bite.
That makes the crude oil price outlook messier than a normal supply squeeze. The shock lifts prices, and then the price starts doing some damage of its own. Demand weakens, but not always fast enough to erase the risk premium.
Hormuz is not a one-day headline
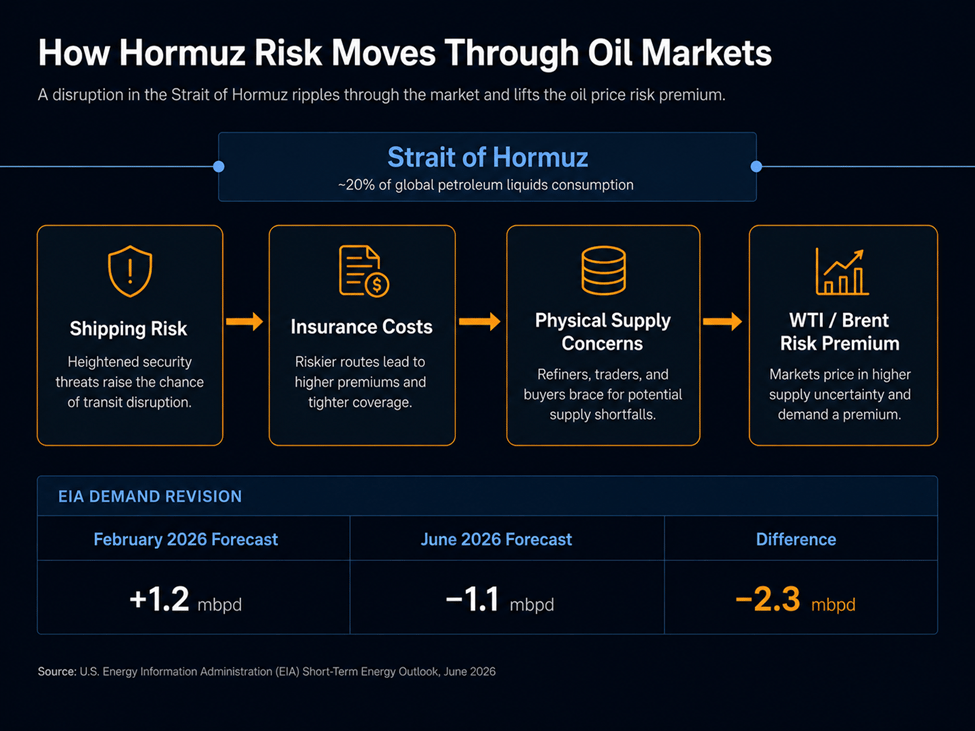
The impact of a Strait of Hormuz closure on oil prices depends on how long traders believe the disruption can last. A short scare is manageable. Inventories help. Some cargoes can be delayed. Governments can lean on reserves if the pressure gets ugly.
A longer disruption is different. Diesel, jet fuel, petrochemicals, shipping rates, and inflation expectations all get pulled into the same argument. At that point, the market stops treating Hormuz as a headline and starts treating it as a constraint.
That is why oil supply disruption fears move before the physical market catches up. WTI can drop on a hopeful diplomatic headline long before tanker schedules look normal again. It can also jump on a security incident before refiners know exactly which cargoes will be delayed.
For a crude oil price outlook for 2026, timing matters more than a neat bullish or bearish label. If Hormuz traffic becomes steadier before demand weakens further, crude loses some geopolitical premium. If the conflict flares again, softer demand may not be enough to keep WTI under pressure.
Gold is still supported, just differently
Gold is not weak. It is simply trading to a different rhythm.
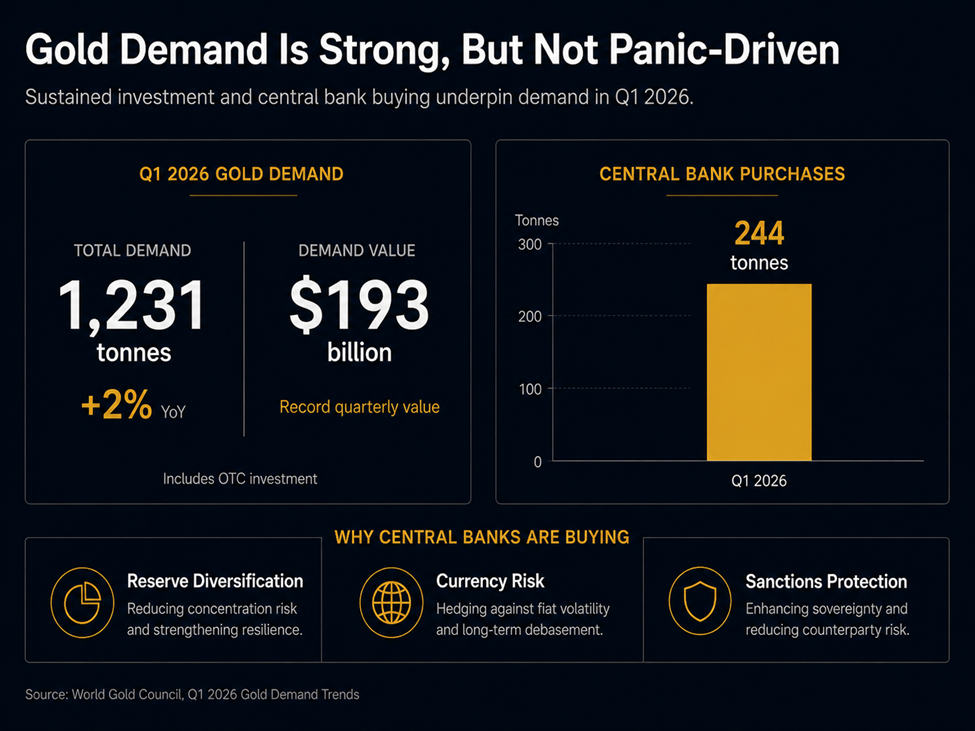
The World Gold Council’s Q1 2026 report put total demand, including OTC investment, at 1,231 tonnes, up 2% from a year earlier. In dollar terms, quarterly demand reached a record $193 billion. Central banks bought about 244 tonnes during the quarter.
That is real gold safe haven demand, but it is not the same as a fast panic trade. Central banks are not buying because one oil route looks dangerous this week. They are buying because reserves, currencies, sanctions exposure, and long-term portfolio protection have become bigger issues.
This is where the gold vs. oil correlation starts to loosen. Oil has the direct exposure. Gold has the second-round exposure through inflation, real yields, the dollar, and official-sector buying.
Oil inflation is not automatically bullish for Gold
A jump in crude usually raises commodity shock inflation risks. That can help gold if investors start worrying about purchasing power or policy credibility. The trade gets trickier when the same inflation pressure makes rate cuts less likely.
That is why the oil shock vs. gold reaction has not been clean. Higher energy prices can invite gold buying, but they can also keep real-rate expectations firmer than gold bulls would like.
Gold still belongs in the safe haven demand gold/silver conversation. It just is not the purest expression of this particular shock. This is not a banking crisis. It is not a sudden dollar-funding panic. It is an energy shock with macro consequences attached.
That makes the geopolitical risk assets comparison more interesting than a simple risk-on or risk-off call. In the current global geopolitical tensions market backdrop, crude is trading on the event. Gold is trading what the event might do next.
The XAU-WTI trade setup
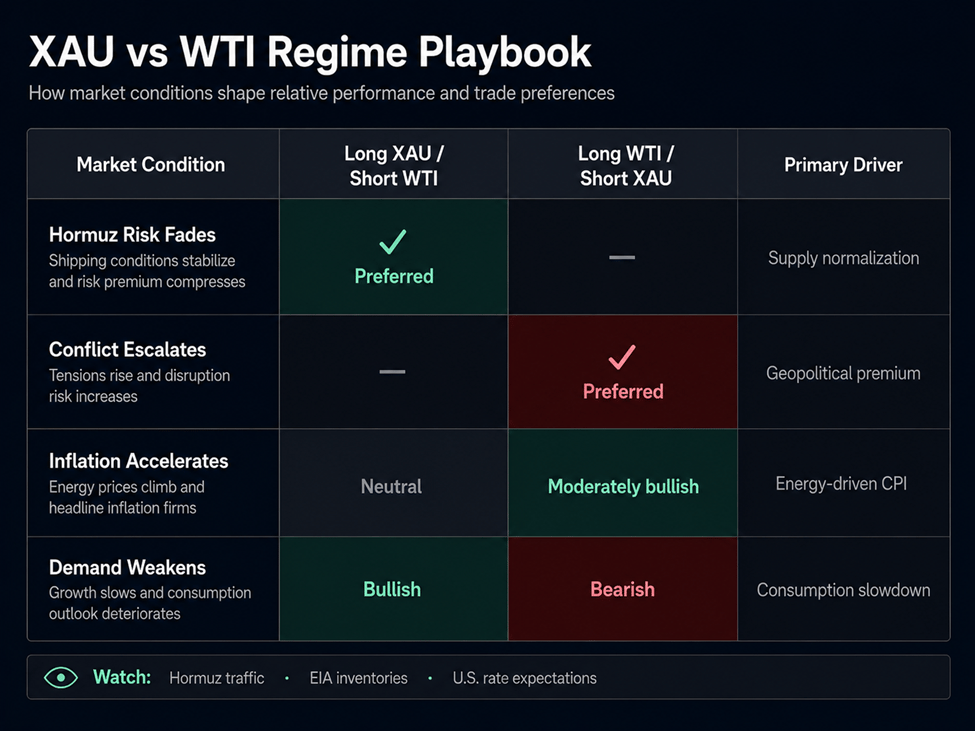
The XAU vs. WTI ratio is useful because it shows which version of risk traders are paying for. When WTI keeps outperforming, the market is paying for disrupted barrels. When gold starts catching up, the focus is shifting toward inflation, policy, or broader financial stress.
Anyone trying to trade gold vs. oil should watch three things closely: actual Hormuz traffic, EIA inventory data, and U.S. rate expectations. Those inputs matter more than broad geopolitical language.
The Brookings analysis of the Strait of Hormuz crisis made the point plainly: even after a reopening, energy markets may need months to settle back down. That is the part traders sometimes miss. Risk premium rarely disappears just because a headline improves.
For commodities vs. defensive assets, the message is fairly direct. Oil is carrying the event risk. Gold is carrying the slower macro hedge.
A versus trade of XAU/WTI depends on which side of that split looks mispriced. Long XAU and short WTI fit a scenario where Hormuz risk cools while central-bank demand keeps gold supported. Long WTI and short XAU fit a renewed escalation trade, especially if inflation expectations rise with crude.
The recent gold vs. oil performance gap makes sense in that frame. Traders are putting more urgency on energy market uncertainty than on a broad rush into protection. This is not only a safe haven vs. energy markets. It is a choice between a barrel that may not arrive on time and a hedge that works more slowly.
Author