Meme Coins Price Prediction: DOGE near breakout, SHIB at ceiling and PEPE leads meme coin recovery
- Dogecoin struggles around the daily resistance at $0.088, a close above suggests a bullish move.
- Shiba Inu pauses its recovery as it approaches key resistance around $0.0000050.
- Pepe extends its rebound on Wednesday, marking six consecutive days of gains.

Meme coins are approaching a key technical level on Wednesday, which could determine the next directional bias. Dogecoin (DOGE) struggles to overcome a major resistance level, and Shiba Inu (SHIB) recovery lost momentum near a crucial barrier. Meanwhile, Pepe (PEPE) extends its rally for a sixth straight day, raising the prospects of further upside if momentum persists.
Dogecoin could extend gains if it closes above key resistance
Dgecoin is attempting to break above the daily resistance at $0.088 on Wednesday, after being rejected from this level on Monday.
If DOGE closes above $0.088 on a daily basis, it could extend the advance toward the 50-day Exponential Moving Average (EMA) at $0.095.
The Relative Strength Index (RSI) on the daily chart hovers just under the 40 mark, hinting at lingering downside pressure, while the Moving Average Convergence Divergence (MACD) has edged slightly above zero with a modestly positive histogram, suggesting only a tentative attempt to stabilize within an entrenched broader downtrend.
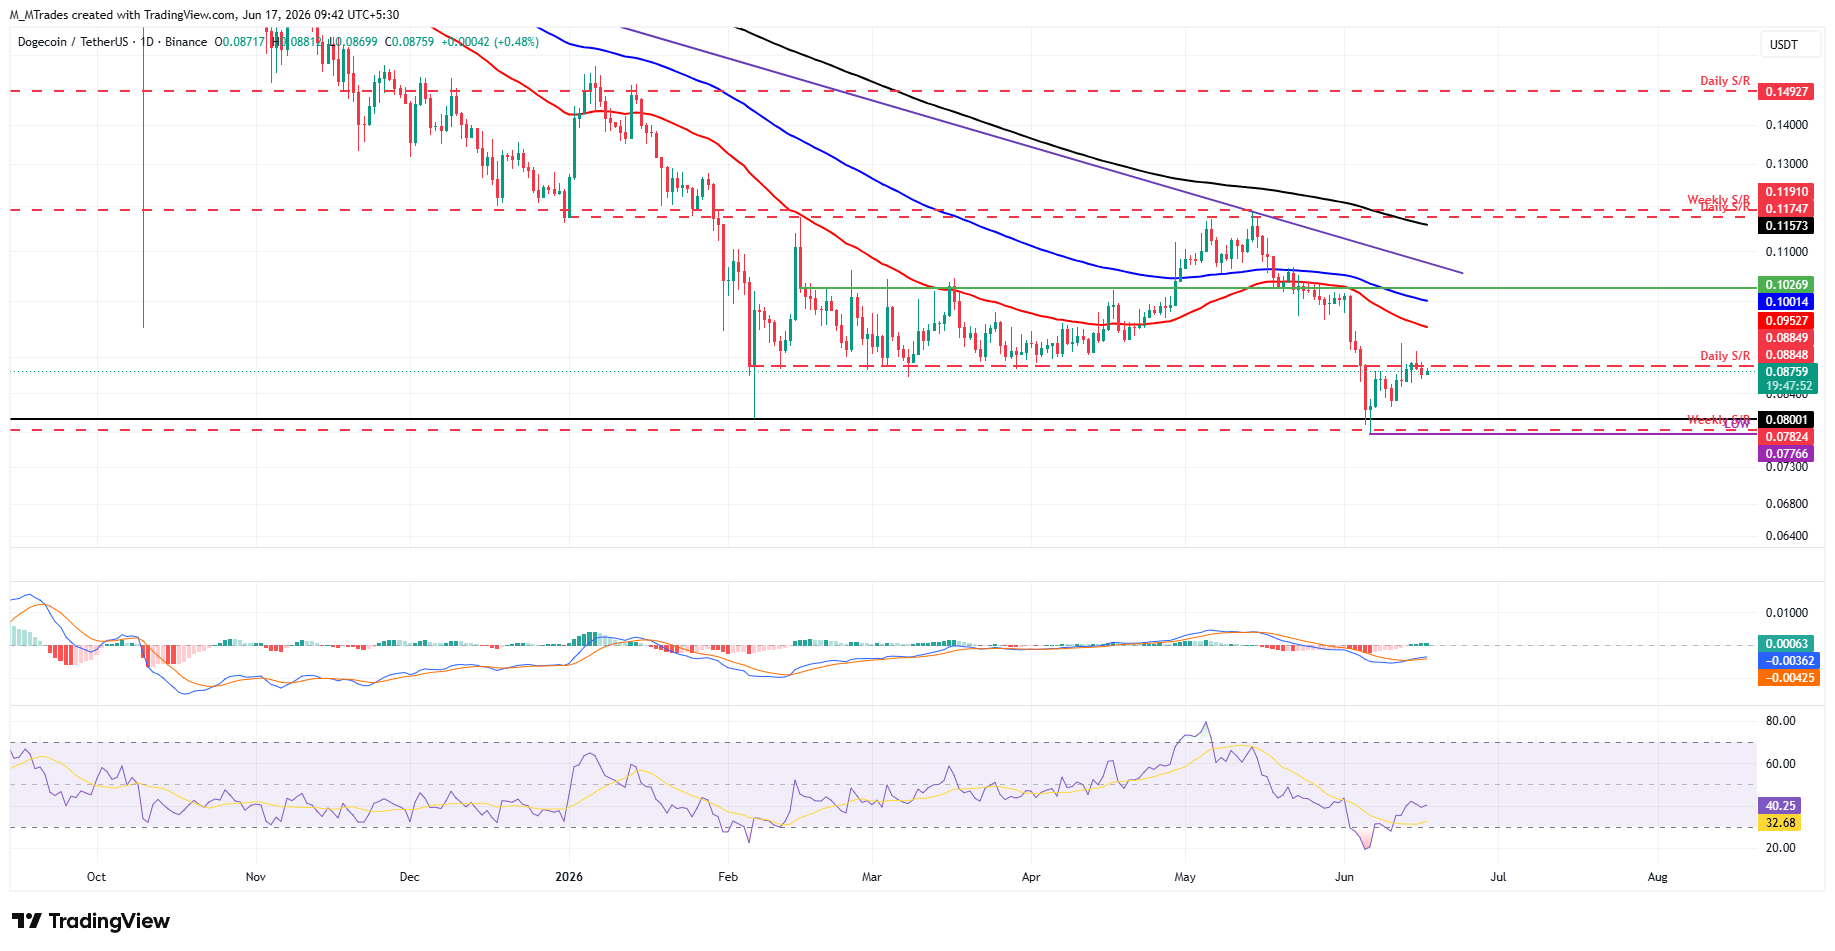
On the other hand, if DOGE fails to close above the $0.088 resistance level and corrects, it could extend the correction toward the next daily support at $0.080.
Shiba Inu faces rejection around the key resistance zone
Shiba Inu price trades at $0.0000050 on Wednesday, after being rejected for the daily resistance level around $0.0000050.
If SHIB rallies and closes above $0.0000050 on a daily basis, it could extend the advance toward the 50-day EMA at $0.0000054.
Like Dogecoin, SHIB’s momentum indicators RSI and MACD show signs of fading bearish strength, which could support the recovery thesis.
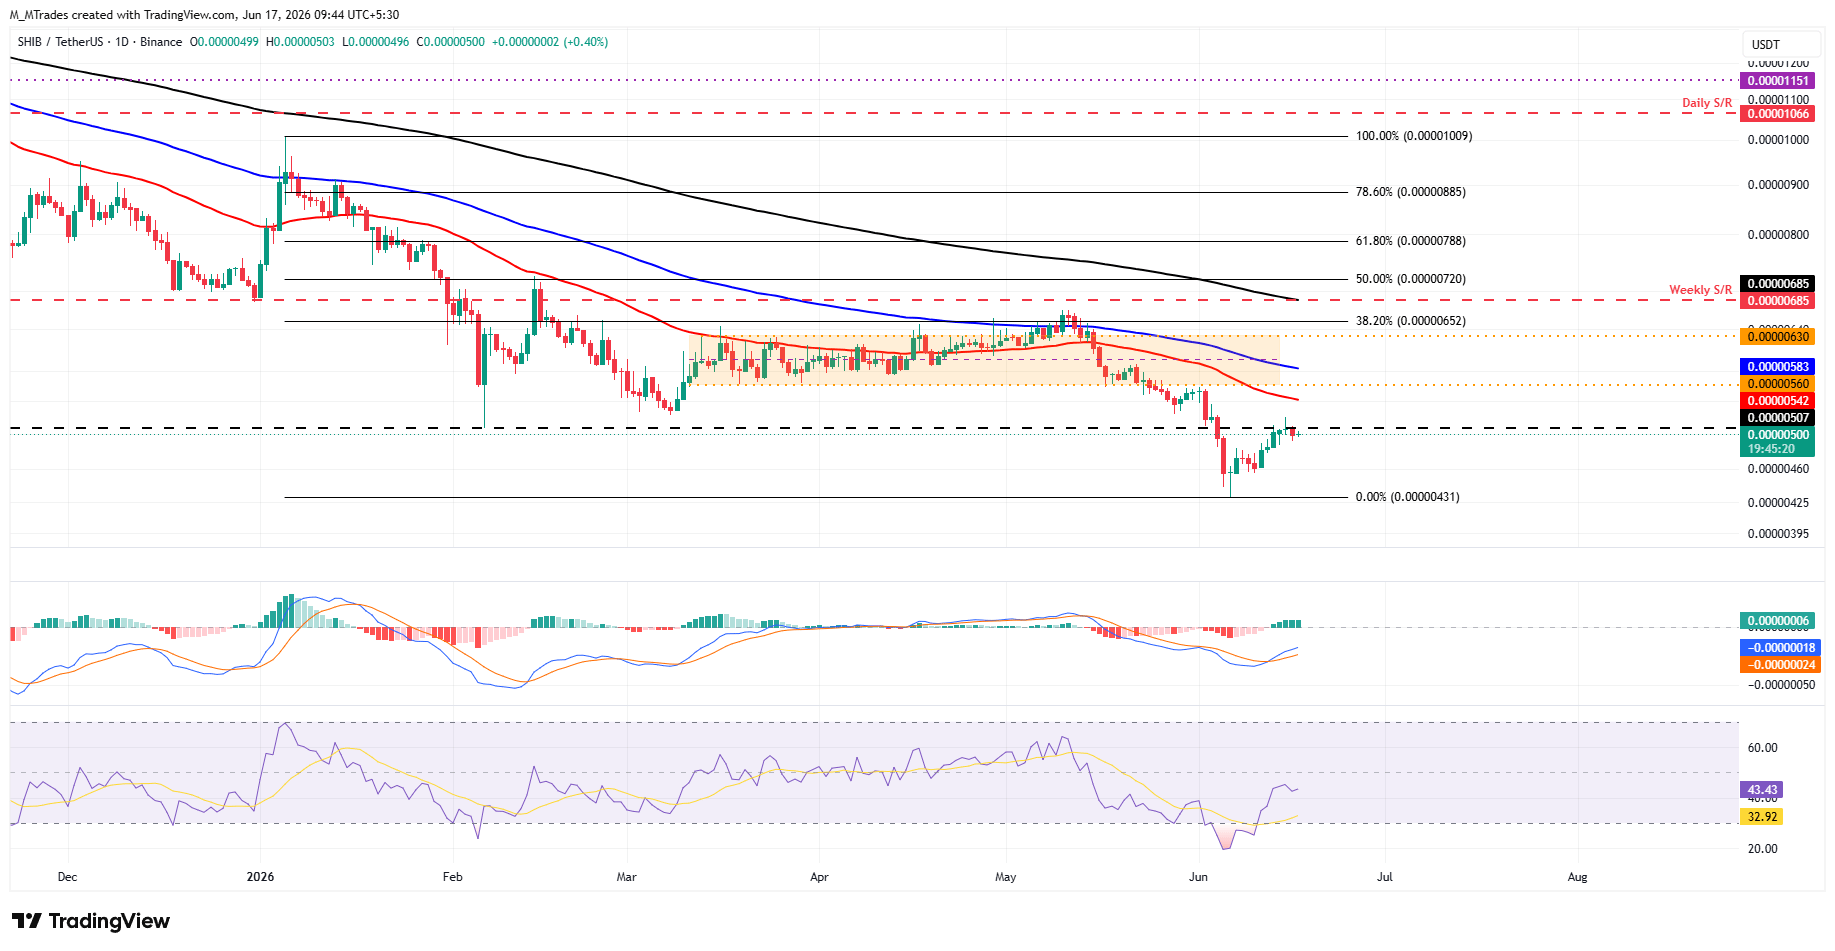
However, if SHIB continues its correction, it could extend the decline toward the June 6 low of $0.0000043.
Pepe’s momentum indicators show fading bearish strength
Pepe is extending its rebound, trading above $0.0000029 on Wednesday, marking six consecutive days of recovery since last week.
If PEPE continues its recovery and closes above the daily resistance at $0.0000031 on a daily basis. PEPE could extend the advance toward the 50-day EMA at $0.0000033.
Like DOGE and SHIB, Pepe’s momentum indicators RSI and MACD show signs of fading bearish strength, which could support the recovery thesis.
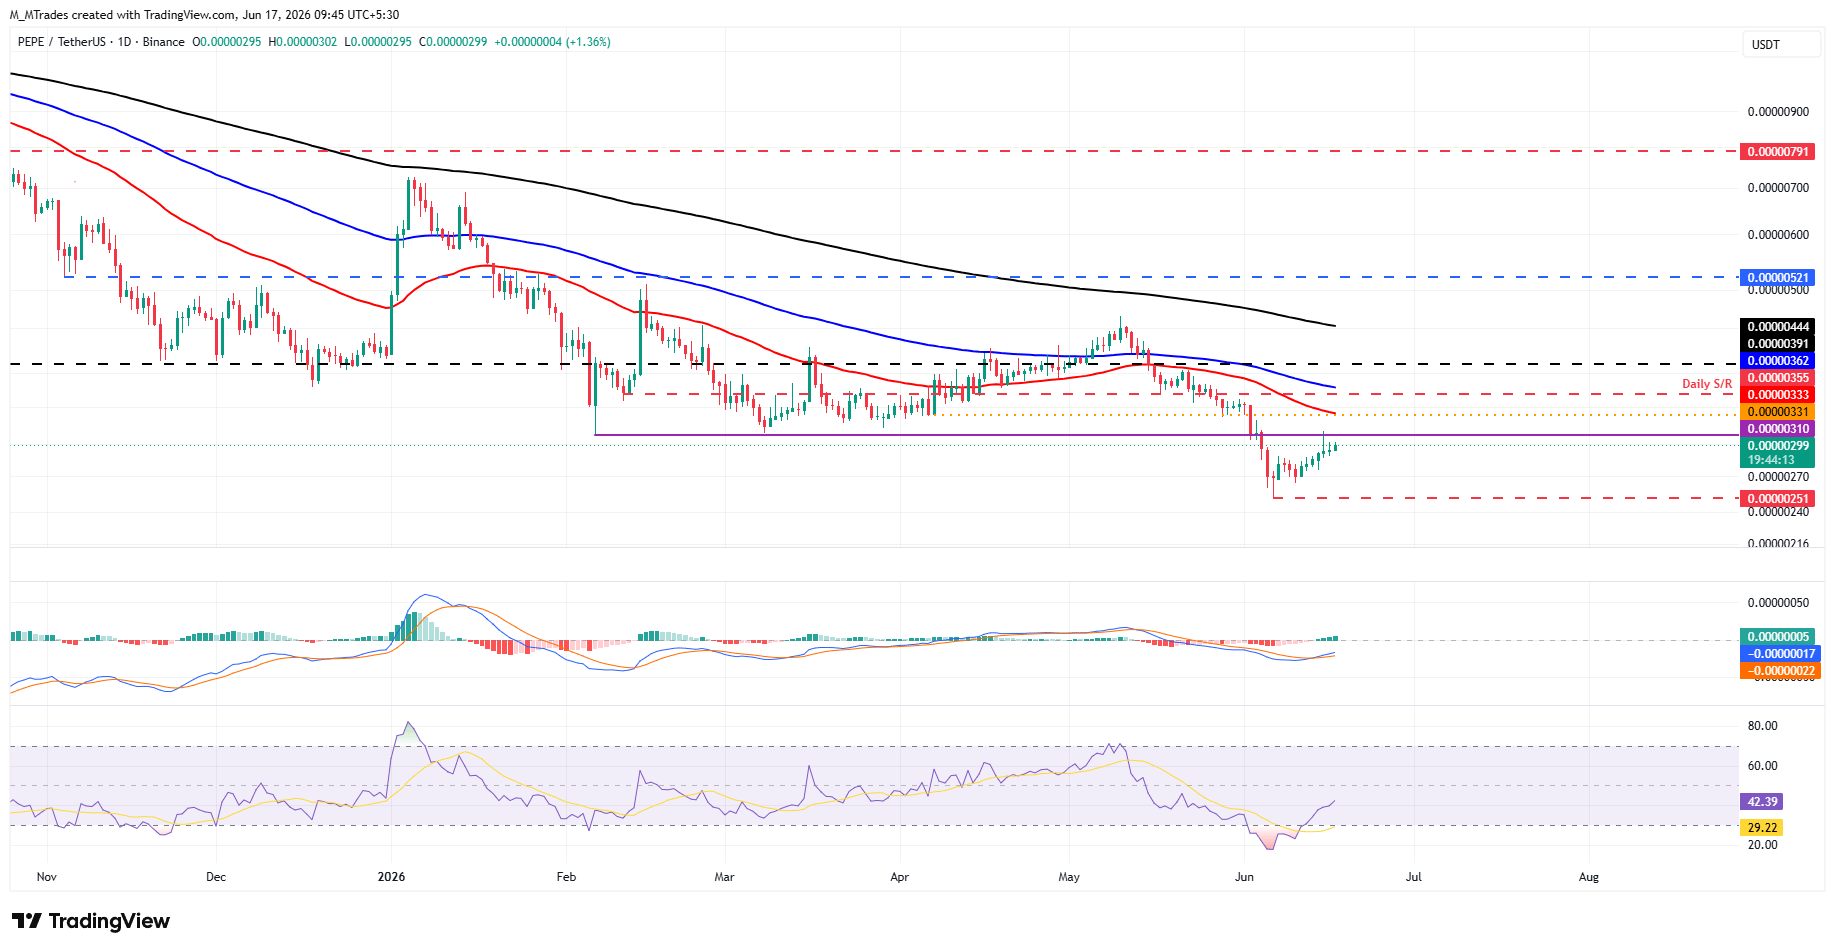
Conversely, if PEPE faces a correction, it could extend the decline toward the June 6 low of $0.0000025.
Author

Manish Chhetri
FXStreet
Manish Chhetri is a crypto specialist with over four years of experience in the cryptocurrency industry.



