|

Oil price forecast: Bull flag breakout confirmed on the Brent chart

The technical structure of the Brent oil market is calling a move higher to fresh four-year highs above the May high of $80.47. At press time, a barrel of oil is changing hands at $79.37.

Daily chart

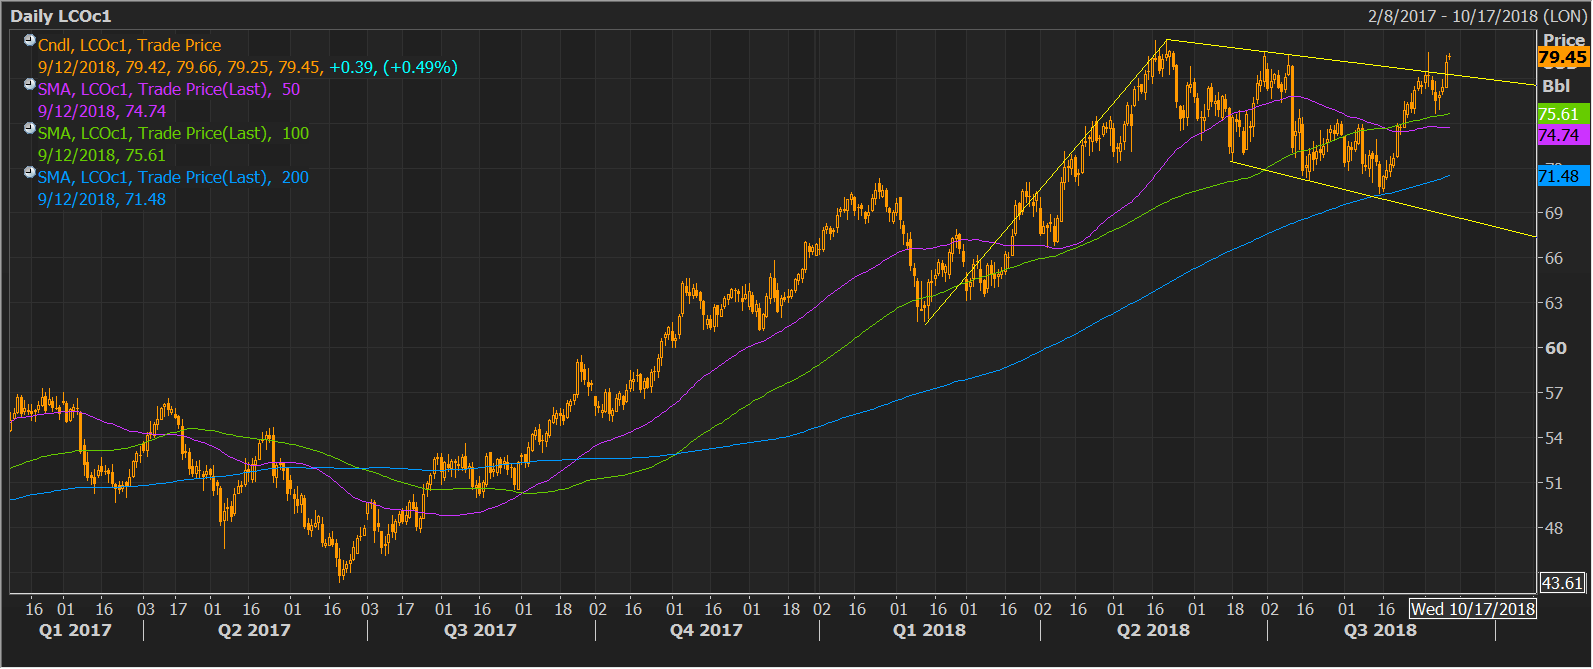
As can be seen, Brent closed at $69.46 yesterday, confirming a bull flag breakout -  a bullish continuation pattern, meaning the rally from the Feb. 13 low of $61.80 has resumed and prices could rise as high as $96.90.

The long-term moving averages (MAs) - 50-day, 100-day, and 200-day - are rising, indicating the path of least resistance is on the higher side. The 5-month and 10-month MAs are also trending north.

Still, the bull flag breakout target of $96.90 looks far-fetched for now. Moreover, such high prices will likely push up inflation, forcing the major central banks to normalize policy at a quicker pace. That, in turn, could lead to EM crisis, the slowdown in the global economy and drop in demand for crude. As a result, the OPEC and other major producers are unlikely to allow oil prices to rally towards $100.

That said, the technical setup is bullish enough to yield a test of the 100-month MA, currently located $82.63. Acceptance above that level would expose the June 2012 low of $88.52. On the other hand, a daily close below the ascending 10-day MA would abort the bullish view.

The bull breakout on the daily chart looks legitimate. Nevertheless, to be on the safe side, traders may wait for confirmation on a weekly closing basis before adopting a strong bullish bias.

Author

Omkar Godbole

Omkar Godbole

FXStreet Contributor

Omkar Godbole, editor and analyst, joined FXStreet after four years as a research analyst at several Indian brokerage companies.

More from Omkar Godbole
Share:

Editor's Picks

EUR/USD holds above 1.1500 after ECB, US PPI

EUR/USD has come under fresh selling pressure and heads toward 1.1500 in Thursday's American trading. The European Central Bank delivered rate hikes as expected, while US wholesale inflation was higher than anticipated in May.

GBP/USD extends slide below 1.3350 on renewed USD demand

GBP/USD is falling below the 1.3350 level in the American session on Thursday. Increased hawkish Fed bets and looming Mideast geopolitical risks sponsor the latest leg up in the US Dollar, particularly after the Producer Price Index jumped to 6.5% YoY in May.

Gold challenges fresh 2025 lows below $4,100

Gold trades around $4,070 a troy ounce, dangerously approaching the psychological $4,000 mark. A softer Core US Consumer Price Index eased concerns about a runaway inflation spiral, but renewed concerns surged after the higher-than-anticipated May US PPI report.

Pi Network: Recovery at risk with 16 million PI tokens ready for unlock

Pi Network edges higher after three days of consecutive losses earlier this week, extending the prevailing downtrend since late April. The scheduled unlocking of 16 million PI tokens on Thursday could add pressure to the intraday recovery. Technically, PI remains under bearish pressure.

Indonesia surprise rate hike may not be enough to save the Rupiah

The surprise rate hike from Bank Indonesia, aimed at protecting the Indonesian Rupiah from sliding further, seems to have worked for now. The rate increase definitely helps, but there’s more work to do if Jakarta wants to ease investors’ concerns for good.

4.2% headline, 0.2% core: Why the Fed's next hike may be targeting the wrong problem

May's CPI put headline inflation at 4.2% on the year, up from 3.8% in April and the hottest reading since April 2023, while core prices rose just 0.2% on the month, undershooting the 0.3% consensus and halving April's pace.