Oil Looks Set to Stage a Mild Comeback

Key Points:
-
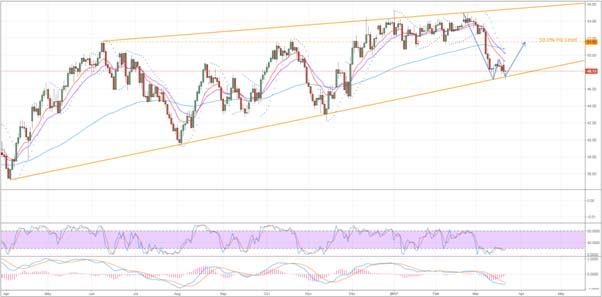
Double bottom structure seems to be forming.
-
Ascending trend line should now come into play.
-
US Inventories build has likely delayed the rally.
Oil prices look to have finally found a bottom, potentially even two of them, which could see buying pressure mount in the coming sessions. Additionally, a number of other technical instruments are signalling that a reversal is on the way which comes as little surprise given the presence of the ascending trend line.
First and foremost, as mentioned above, there seems to be a double bottom forming up on the daily chart which indicates selling pressure may be running thin. To some extent, this will a result of oil moving into oversold territory as is made clear by the stochastic oscillator. However, the impending MACD signal line crossover is also suggestive of a near-term change in momentum.
Aside from these near-term technical readings, the long-term trend line provides what is probably the strongest argument for a reversal. As is shown above, the commodity is drawing fairly close to the ascending line which will certainly have the bears worried. Indeed, their inability to push substantially below this level is evident in the long shadows of the two candles that form the troughs of the depicted double bottom structure.
Although, given the shift in the EMA bias to bearish, gains could be fairly muted for oil which might mean we instead see it drift lazily higher rather than reversing sharply as forecasted. The main counter argument to this would be the mere fact that the commodity is now below the $50 handle, a handle that has only recently been priced in as the medium to long-term average. However, the neckline of the double bottom is also relatively shallow which makes it a fairly achievable zone to break through, meaning, sparking a rally typical of the double bottom pattern will be relatively easy.
Once an upswing has taken hold, we expect gains to extend to, at most, the 51.55 handle. This price is somewhat shy of what would generally be forecasted for a chart pattern such as this, however, there is some reason to doubt the overall strength of the rally. Firstly, the 100 day moving average is likely to be a source of dynamic resistance which will begin to cap upsides around the 50.70 mark. This being said, the real challenge will be in overcoming the 50.0% Fibonacci level around the 51.55 level as it also coincides with a number of historical reversal points.
Ultimately, yesterday’s 4.95M build in US Crude Oil Inventories could delay the forecasted uptrend for a few sessions. Although, the fact that such a build barely managed to push the commodity lower could also be taken as a sign that it is ready to surge higher when fundamentals stop weighing it down. However, also stay on the lookout for any developments from OPEC as the cartel is likely to have something in the wings to re-float oil prices going forward which would suit this technical forecast just fine.
Author

Matthew Ashley
Blackwell Global Investments Limited
Matthew joined Blackwell Global in March 2016; he works as a currency analyst in the research department based in Auckland.


