Oil Jumps as Middle East tensions escalate: What history shows

Markets opened the week reacting to a sharp escalation in Middle East tensions, sending oil prices higher while risk assets stumbled. Today, oil gapped up to $75, but is now cooling off to around the 70s.
The initial move highlights just how sensitive energy markets remain to geopolitical risk, particularly when tensions involve key oil transit routes such as the Strait of Hormuz.
Around one fifth of the world’s oil supply moves through this narrow waterway, making it one of the most important energy choke points in global markets. Even the possibility of disruption can quickly push prices higher as traders price in supply risk.
However, history suggests these spikes are often sharp but not always sustained.
Oil spikes first during geopolitical crises
Energy markets tend to react immediately when conflicts emerge in oil-producing regions.
During the Gulf War (Aug 1990 – Feb 1991), oil prices surged nearly 97% as traders feared a major disruption to Middle Eastern supply.
Yet once the situation stabilised, prices reversed sharply and eventually dropped more than 50% in January 1991.
A similar dynamic played out during the Russian invasion of Ukraine in February 2022. Oil initially surged roughly 35% in March, only to retrace once markets adjusted to the new supply environment.
This pattern reflects a common dynamic in commodity markets.
Geopolitical shocks often create immediate supply fears, but once markets gain clarity on whether actual production or shipping is disrupted, prices tend to stabilise.
The current situation appears to be following a similar early-stage pattern.
Oil briefly surged toward $75 as traders reacted to rising tensions in the Middle East and the potential risk to key transit routes such as the Strait of Hormuz.
As it stands, the Strait of Hormuz has not been officially closed, and shipping traffic has not fully stopped. For now, the market appears to be pricing in the risk of disruption rather than confirmed supply losses, which explains why oil has already begun cooling back toward the low $70s.
Oil now testing a key technical zone
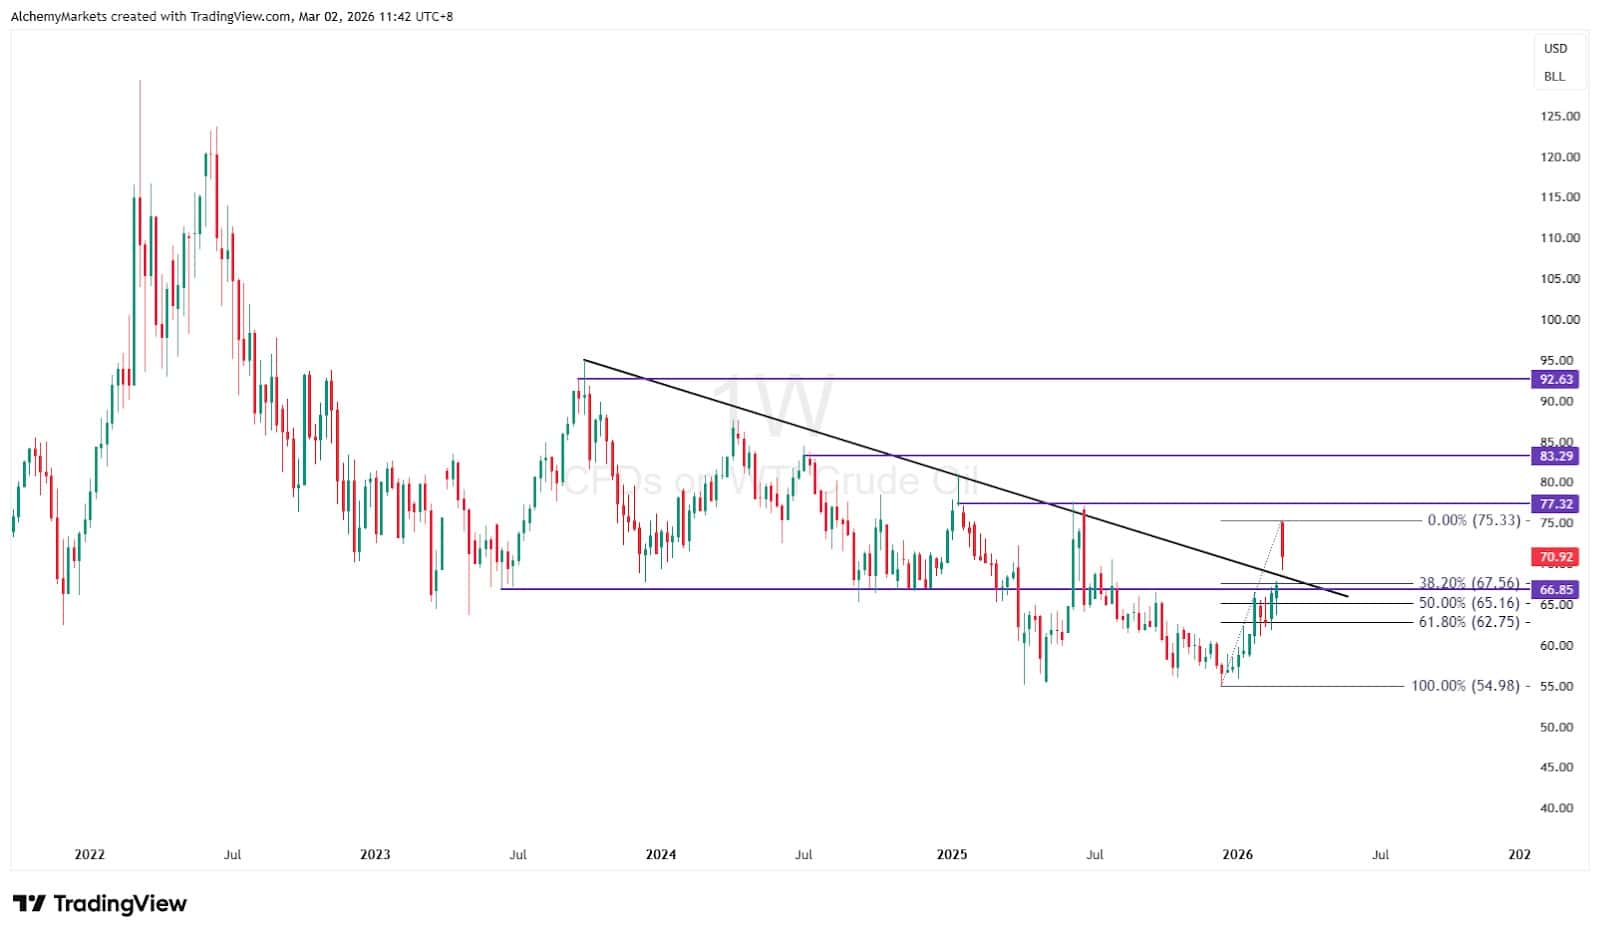
Beyond the headlines, oil is also approaching an important technical area.
The weekly chart shows crude rebounding strongly from the $55 region, where buyers previously stepped in earlier this year. From there, prices rallied back toward the mid-$60s, breaking above a key resistance level ($67) and hinting at a trend reversal.
This $67 region is significant for several reasons
- It sits near the 38.2% Fibonacci retracement.
- It aligns with the descending trendline that has capped rallies since 2023.
- It marks the level where previous rallies have repeatedly stalled.
If Oil holds
- The next resistance sits near $77, which has acted as a major pivot level.
- A sustained break above that zone could open the door toward $83.
- A larger resistance around $92, where a previous high sits.
However, if prices fail to hold above the $67 breakout area, the move could still prove to be another short-lived geopolitical spike.
With tensions still evolving and the Strait of Hormuz remaining open, traders will be watching closely to see whether the current spike develops into a sustained breakout, or fades as geopolitical uncertainty stabilises.
Author

Zorrays Junaid
Alchemy Markets
Zorrays Junaid has extensive combined experience in the financial markets as a portfolio manager and trading coach. More recently, he is an Analyst with Alchemy Markets, and has contributed to DailyFX and Elliott Wave Forecast in the past.


