Oil Builds Bearish Wave 1 and Reversal

Meta description:
The Oil chart seems to have completed 5 bearish waves within a wave 1, which could indicate a larger bearish reversal unless price breaks above the top.
Oil
Month
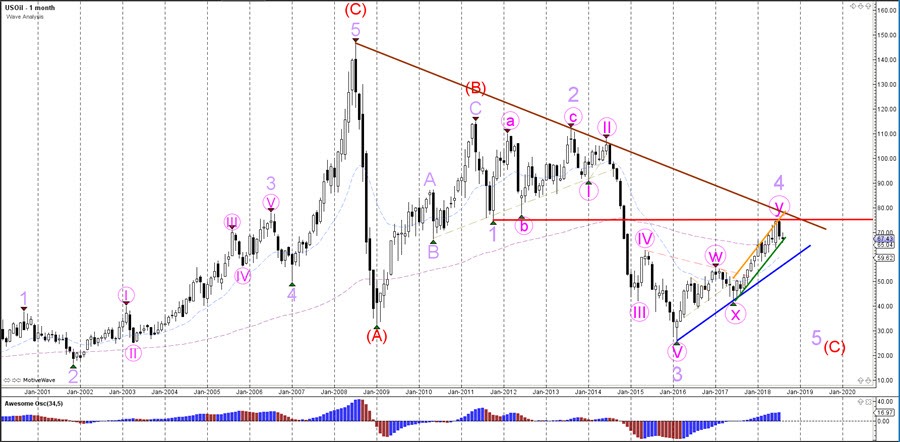
The Oil chart seems to have completed 5 bearish waves (purple) within a wave 1 (pink), which could indicate a larger bearish reversal unless price breaks above the top.

Wave 5 (blue) could already be completed if price breaks above the resistance trend line (red) of the downtrend channel. If price manages to break through support (blue), then a bearish continuation of wave 5 (blue) towards the Fib targets is possible.
Week
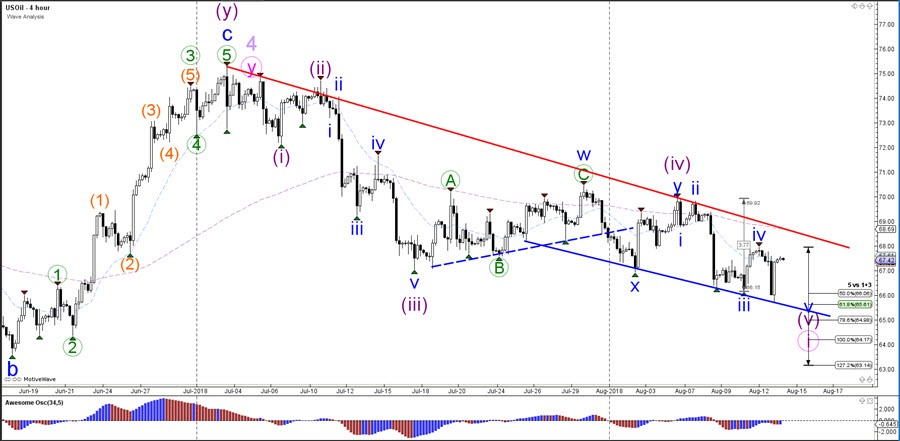
Oil is building a potential bearish wave 1 (pink). A bullish retracement could be part of a wave 2 (pink) if price manages to stay below the 100% Fib level. A break above that top invalidates the wave 1-2 pattern.
Day
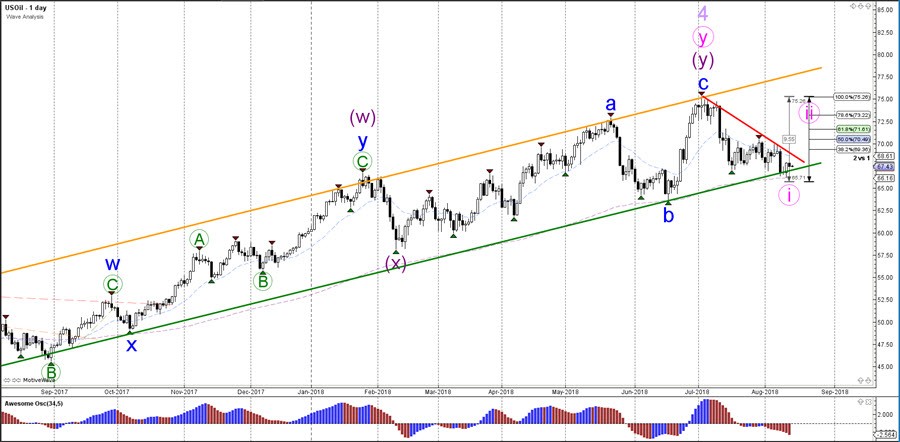
Oil is building a potential wave 4 (purple) as long as price stays below the resistance trend line and bottom of wave 1 (red line). A bearish break below support could indicate a downtrend continuation.
Author

Chris Svorcik
Elite CurrenSea
Experience Chris Svorcik has co-founded Elite CurrenSea in 2014 together with Nenad Kerkez, aka Tarantula FX. Chris is a technical analyst, wave analyst, trader, writer, educator, webinar speaker, and seminar speaker of the financial markets.


