Oil and Gold: Price review for the week ahead

This preview of weekly data examines USOIL and XAUUSD, with economic data expected later this week as the primary market drivers of the near-term outlook.
Highlights of the week: British manufacturing & services PMI, US PCE & GDP growth.
Tuesday
Flash British manufacturing PMI at 08:30 AM GMT. The expectations for the figure are at 53.6 compared to the previous 53.9. UK manufacturing has managed to remain above the 50-point mark since October 2025, and if the expectations are confirmed, then it might create some short-term gains for the pound.
Flash British services PMI at 08:30 AM GMT. Market participants are expecting the publication to increase to 50 points compared to the 49.3 points of May. The services sector in the UK has managed to remain above the 50-point mark for the last 20 months (excluding April of 2025 and May 2026). This shows the health and strength of the service sector in the UK and could potentially create some support for the pound in the immediate aftermath of the release.
Thursday
US core PCE is expected to be released at 12:30 GMT and is anticipated to increase by 0.1% for May. The PCE index shows the changes in the price of goods and services bought by consumers for consumption, and it excludes food and energy. The PCE reading is one of the vital components taken into account by the Federal Reserve when deciding on its monetary policy, and a slowdown in the Index reading could probably influence a more dovish stance on the Fed's next meeting.
US GDP growth rate for the first quarter at 12:30 PM GMT. Market consensus is for an increase from 0.5% to 1.6%. This data is considered a lagging indicator since it's for the previous quarter rather than the one currently running, so the data might be already priced in; therefore, it might not have a significant effect on the greenback.
USOIL, daily
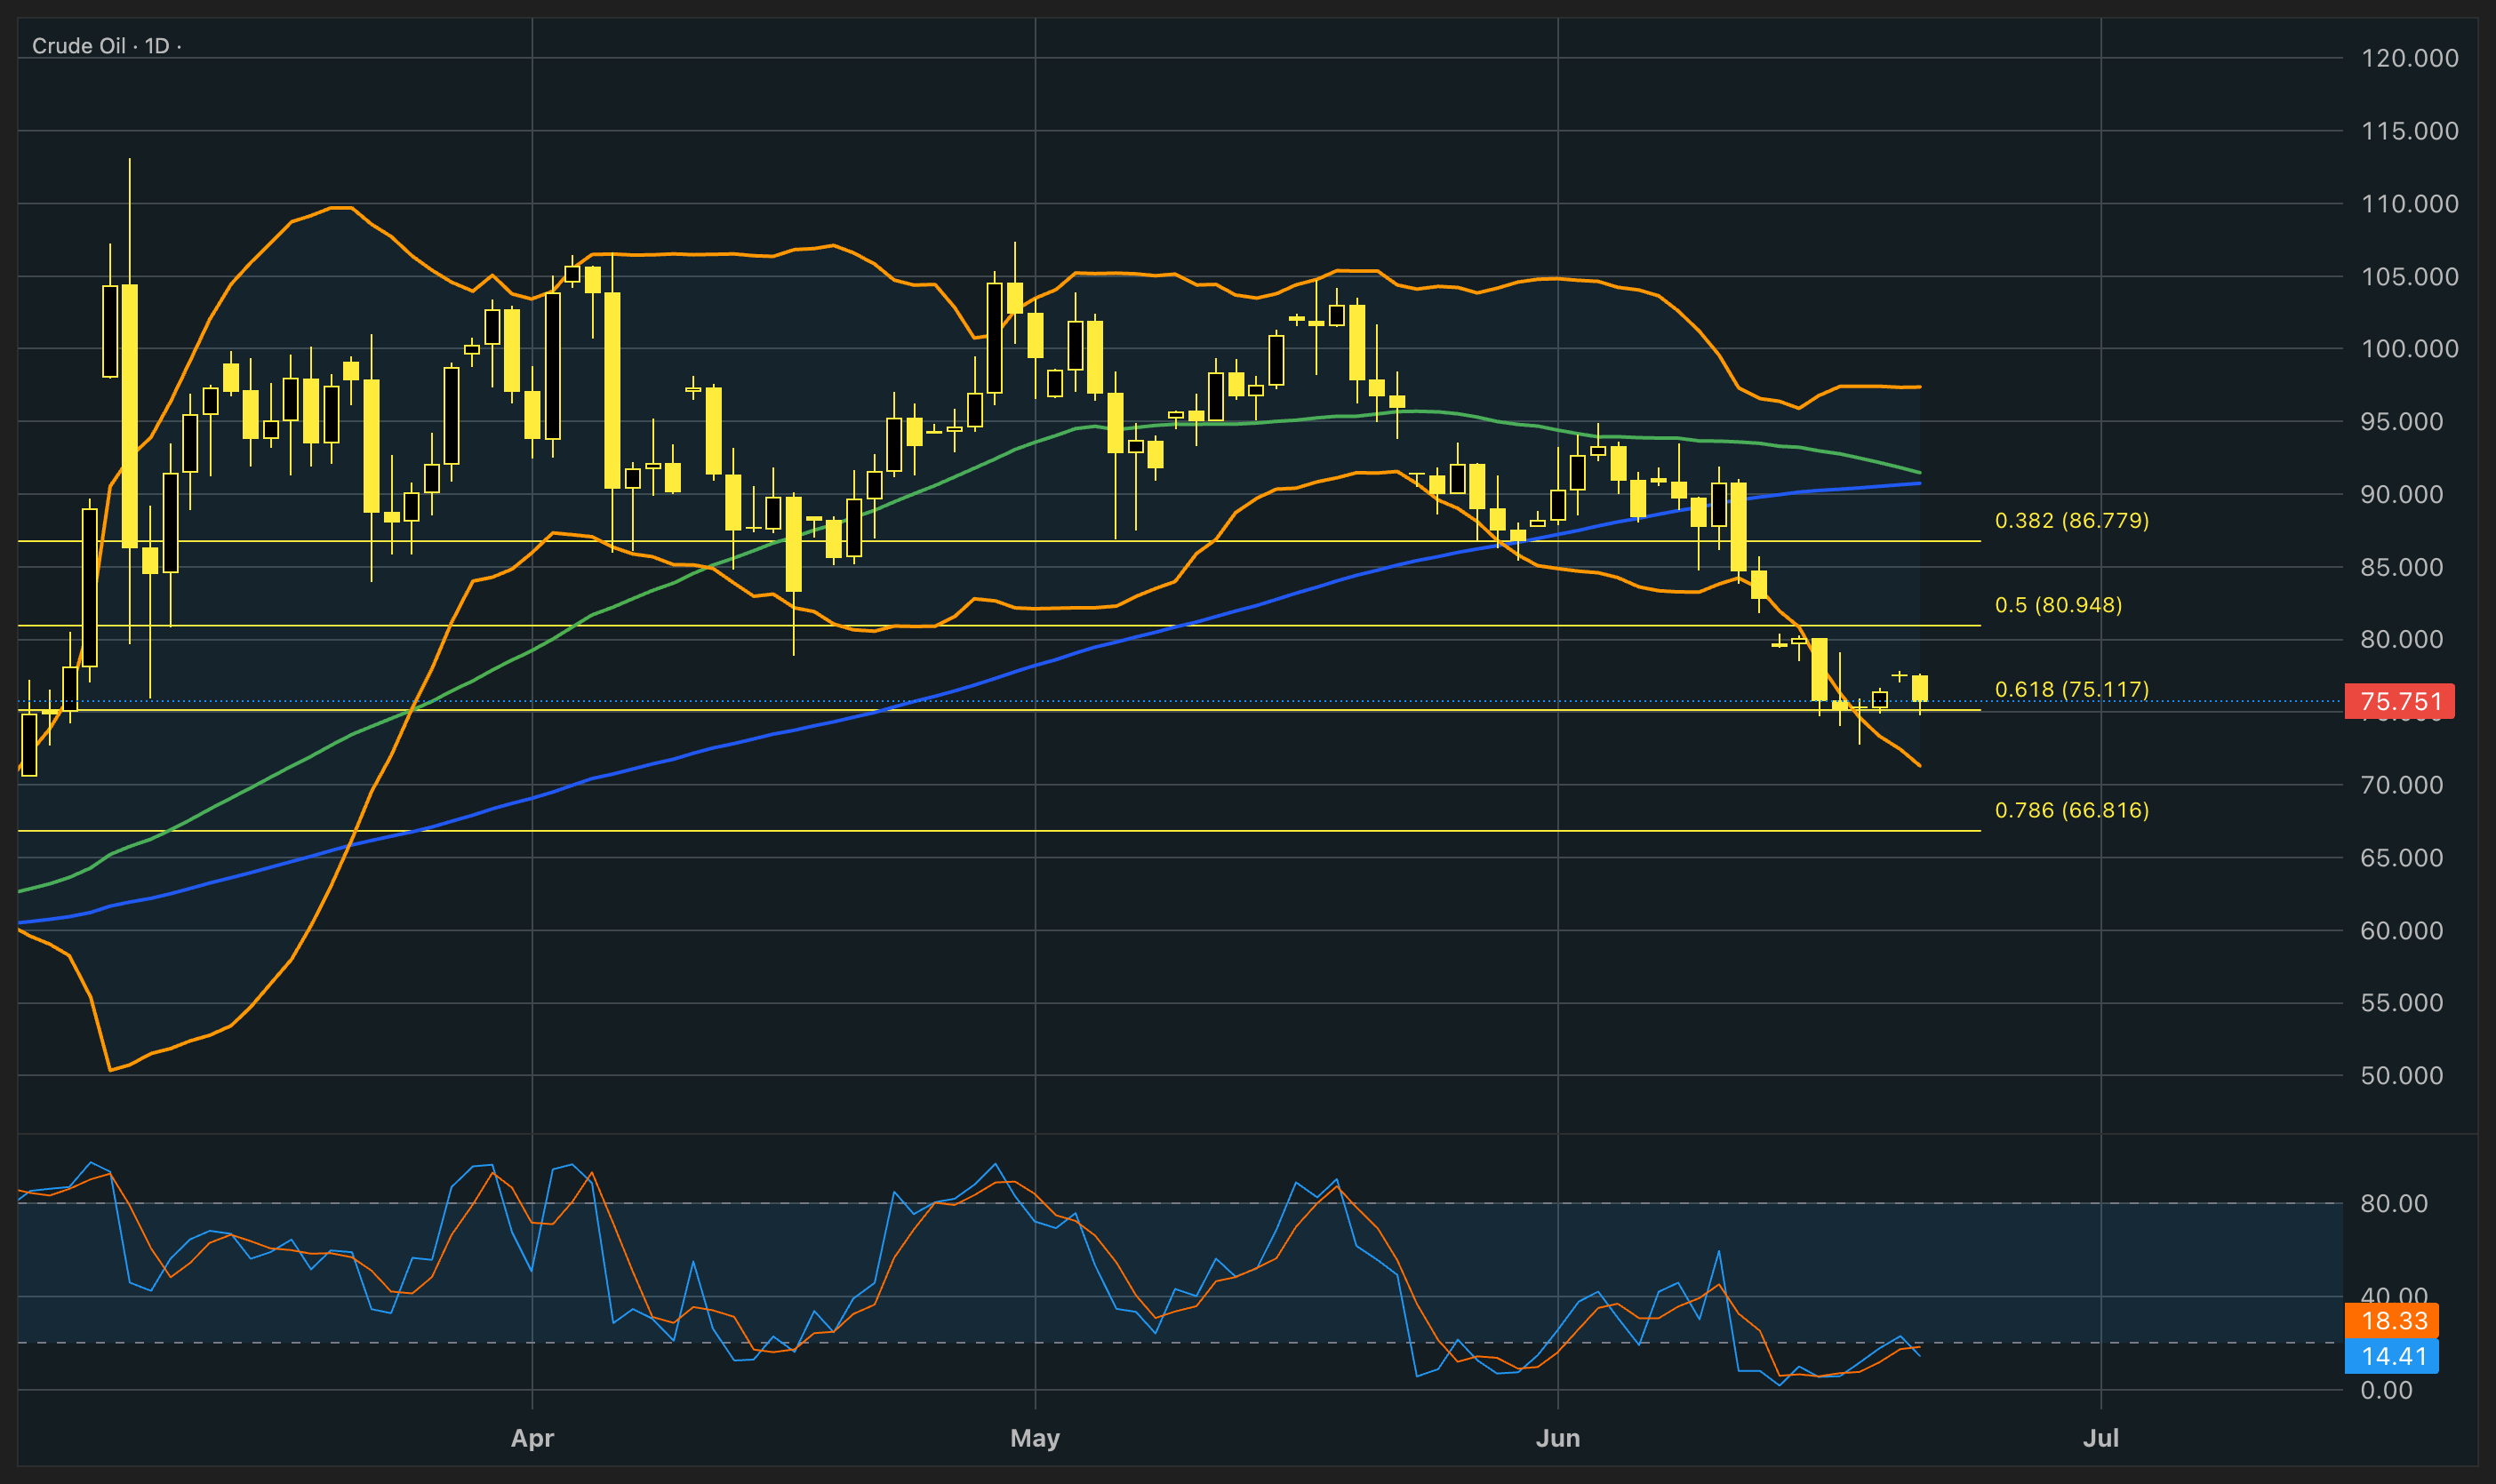
Oil prices fell as progress in peace talks between the US and Iran increased expectations of a potential resolution to the Middle East confl ict. Negotiators agreed on a roadmap toward a fi nal deal within 60 days, with technical discussions continuing. Markets remain cautious as supply disruptions from the region continue, although some fl ows have resumed. A potential peace agreement could bring signifi cant additional supply back to the market, especially amid weaker demand from China. Gulf producers are preparing to increase output, with some removing supply restrictions and encouraging customers to resume shipments. However, analysts warn that uncertainty over security and vessel activity could limit a quick return to normal supply levels.
From the technical analysis perspective, crude oil extended its bearish correction last week and found suffi cient support around $75, which is an area consisting of the lower band of the Bollinger Bands and the 61.8% daily Fibonacci retracement level. Currently, it is testing this major support area while the Stochastic oscillator is at extreme oversold levels. This could hint at a minor bullish correction in the upcoming sessions, but since oil is mostly infl uenced by fundamentals and geopolitical updates, the signs from the oscillator might not be so relevant. The Bollinger Bands are quite expanded, showing that volatility is growing, and at the same time, the moving averages are on the move to cross, validating the bearish momentum. If the price keeps declining, then the fi rst area of potential support might be seen around the $70 area, which is the psychological support of the round number and also an area of price reaction at the beginning of March.
Gold-Dollar, daily
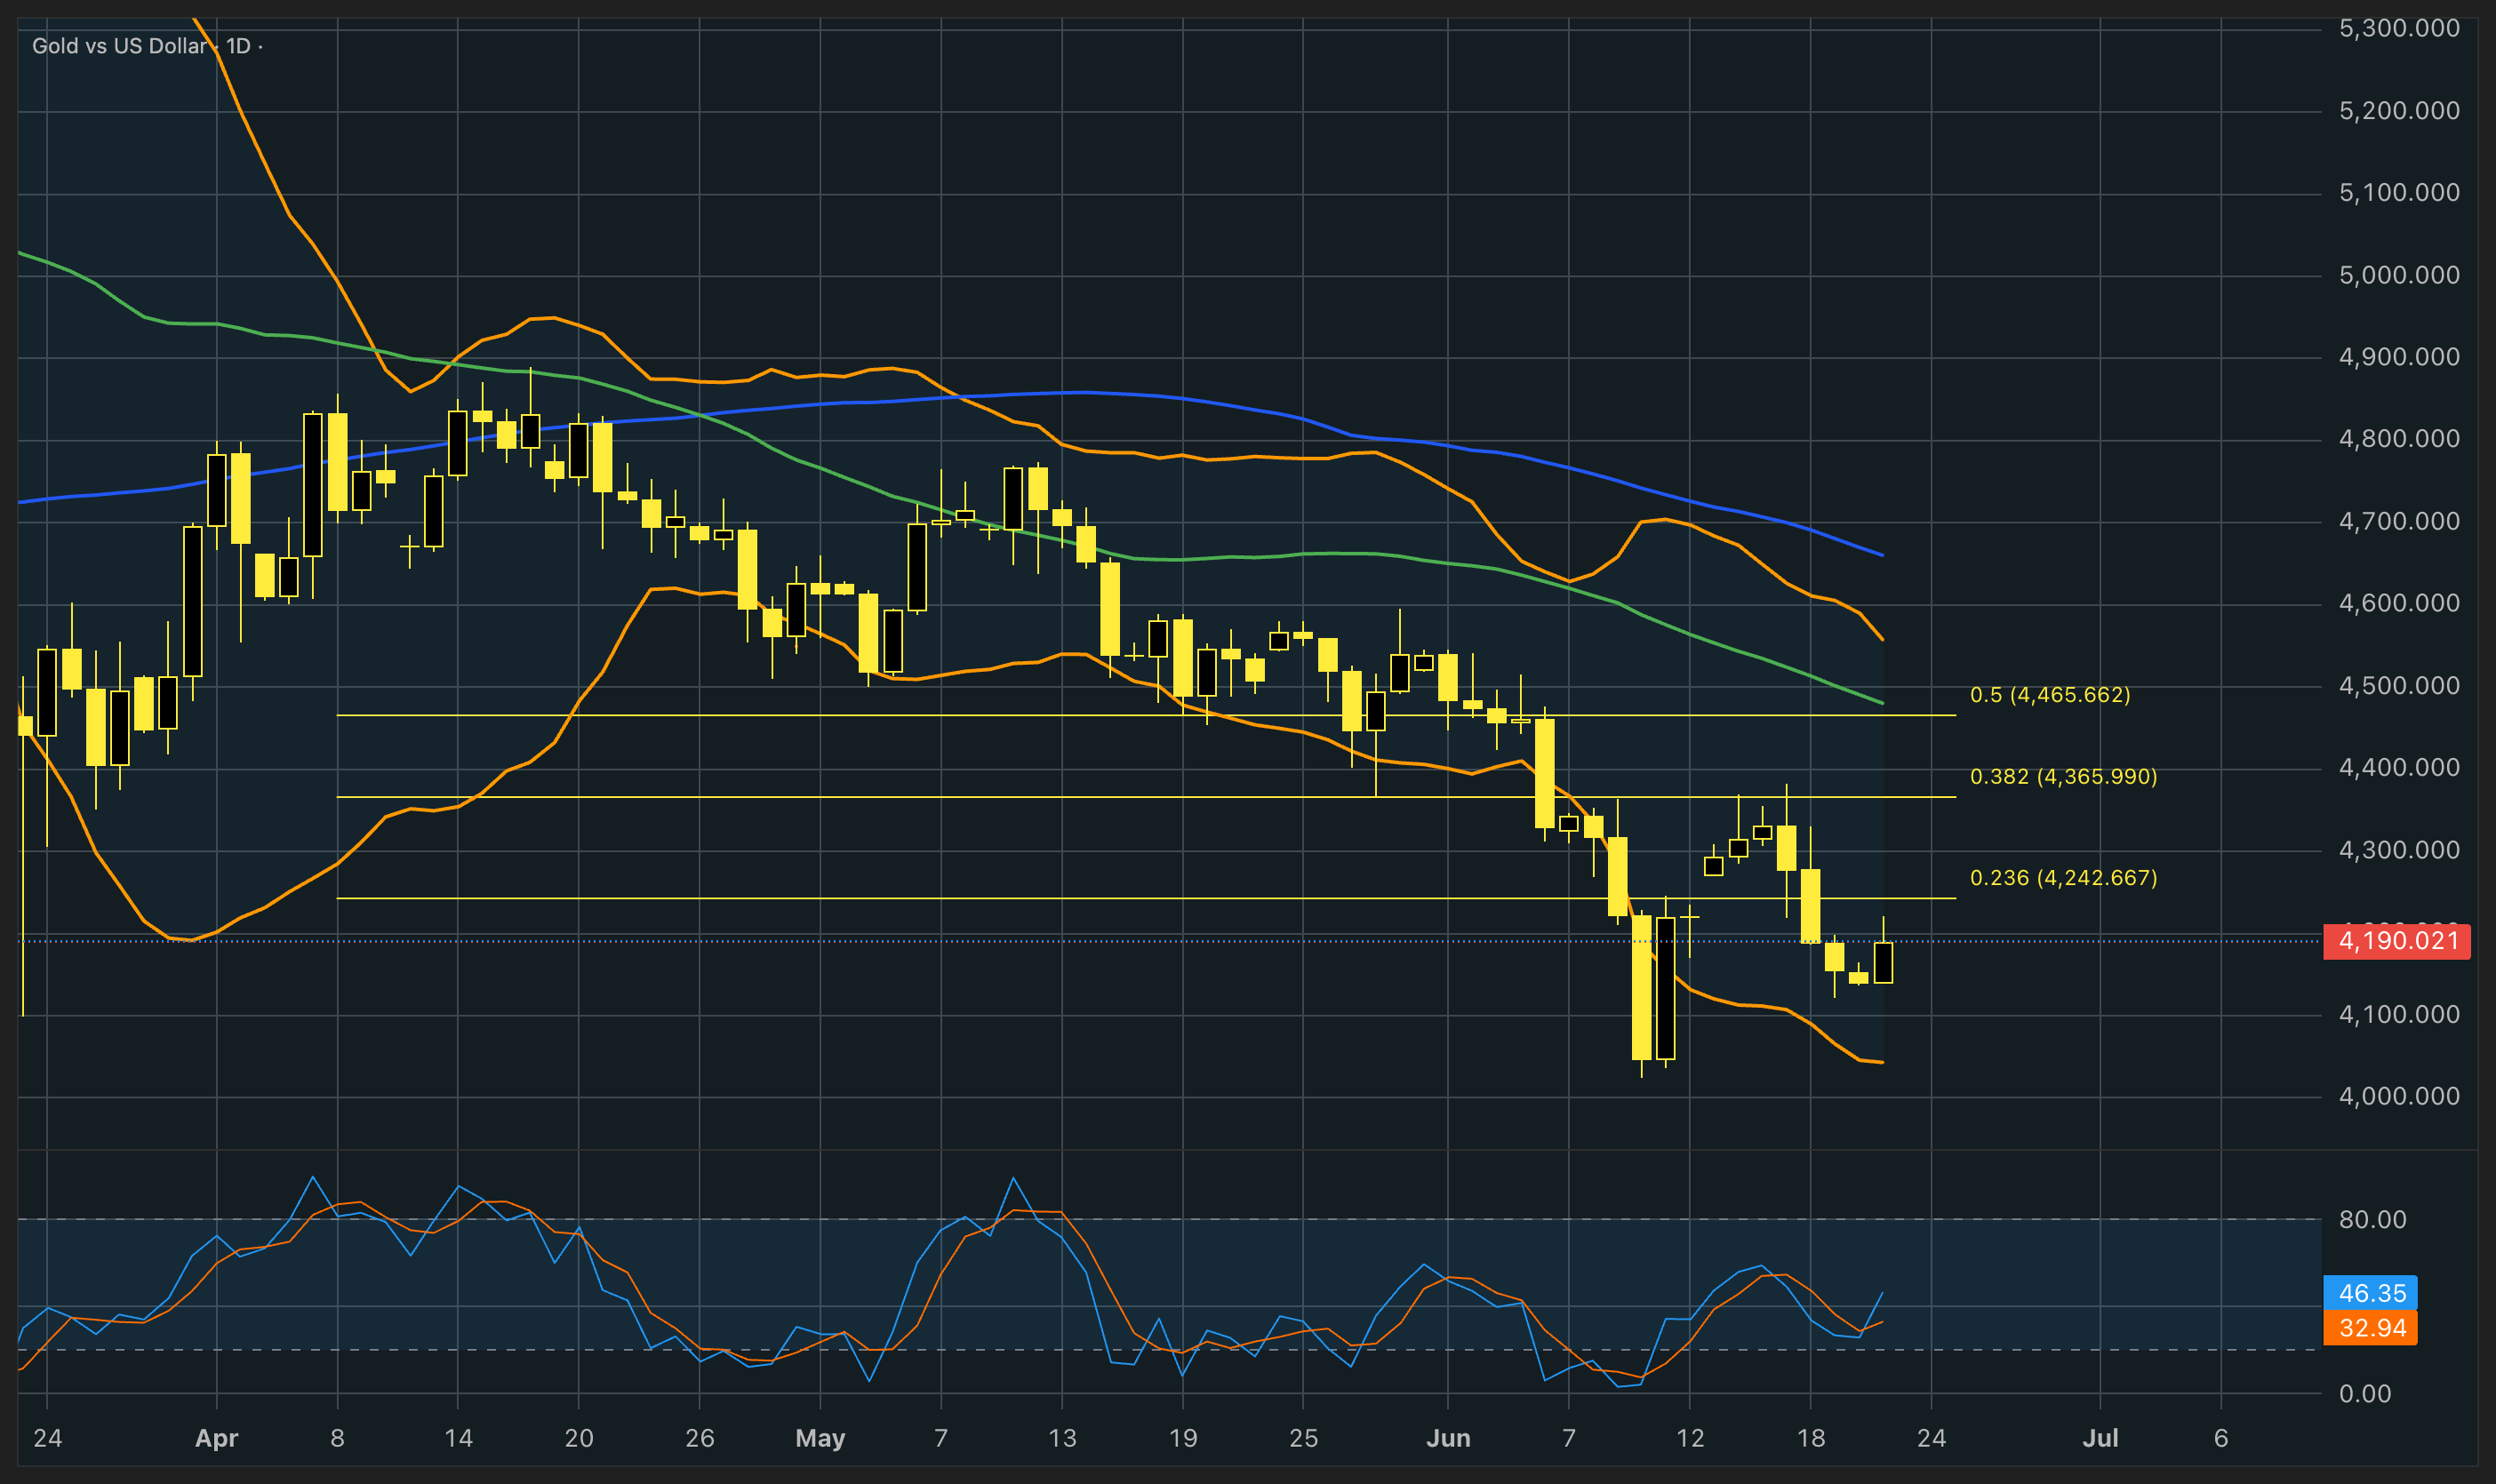
Gold rose as progress in US-Iran peace talks boosted demand for safe-haven assets. Negotiators reported “encouraging progress” during discussions in Switzerland, with talks continuing through the week and eff orts underway to secure safer shipping routes. Markets reacted positively to signs of de-escalation, though uncertainty remains around the confl ict and its impact on energy fl ows. Gold had previously declined for three straight weeks as higher energy prices raised infl ation concerns and increased expectations of tighter monetary policy. Investors are now watching upcoming US infl ation data for clues on the Federal Reserve’s interest-rate outlook, especially after a more hawkish tone from the central bank’s leadership.
From a technical point of view, gold seems to be rebounding around $4,200 after fi nding strong resistance on the 38.2% weekly Fibonacci retracement level. The Stochastic oscillator is kept in neutral levels, and the Bollinger Bands are suffi ciently expanded, hinting that there is potential for the price to move in either direction in the near short-term. The moving averages are validating the overall bearish trend for now, but geopolitical developments could greatly aff ect the price of the yellow metal. Purely based on technicals, the price could rebound and test the resistance of the 38.2% Fibonacci around $4,400 again, given that no new catalyst enters the play. On the other hand, if the price does continue declining, then the fi rst area of support might be seen around $4,000, which is the psychological support of the round number as well as the latest low of the swing.
Author

Antreas Themistokleous
Exness
Antreas has been trading CFDs since 2018 using a combination of fundamental and technical analysis.