|

NZD/JPY Elliott Wave forecasting the path: Zig zag pattern

In this article we’re going to take a quick look at the Elliott Wave charts of  NZDJPY published in members area of the website.  NZDJPY has given us recently ((x)) connector that unfolded as Elliott Wave Zig Zag pattern.  Pull back completed right at the extreme zone as we expected. In the further text we are going to explain the Elliott Wave Forecast.

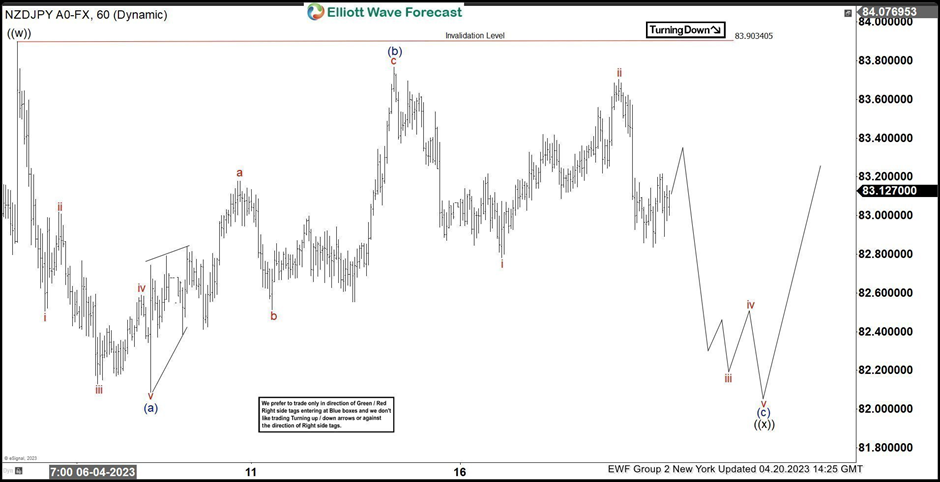
NZD/JPY Elliott Wave 1 hour chart 04.20.2023

We are calling cycle from the 83.90 still in progress. We got 5 waves decline from the mentioned peak which suggests we ended only first leg of the correction. Wave (b) was deep recovery, however as far as the price stays below 83.72 high, we still expect to see another wave down which should also unfold as 5 waves.   More precisely we are now in wave iii of (c) of ((x)). The pair is targeting 81.95-81.52 area. As our members know we target get by Fibonacci extension tool. Mentioned zone is equal legs area from the 83.90 peak.

NZDJPY

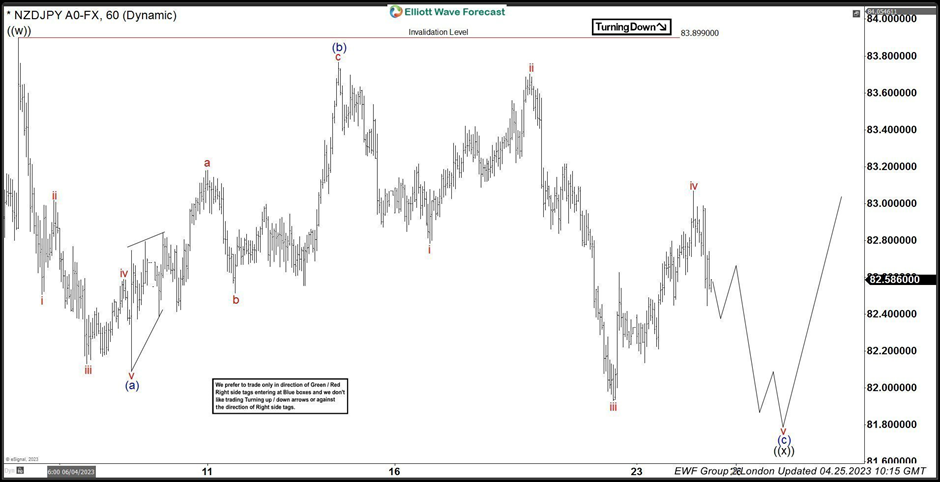
NZD/JPY Elliott Wave 1 Hour chart 04.25.2023

The pairs has given us decline toward proposed area. However at this moment (c) leg shows incomplete sequences. The pair is missing another wave down so we can count clear 5 waves in (c) blue wave. While below 83.05 high, we assume iv red is competed there and wave v is in progress. More precise target zone for wave v red would be inverse 1.236-1.618 fib ext of wave iv that comes at 81.69-81.27 area.

NZDJPY

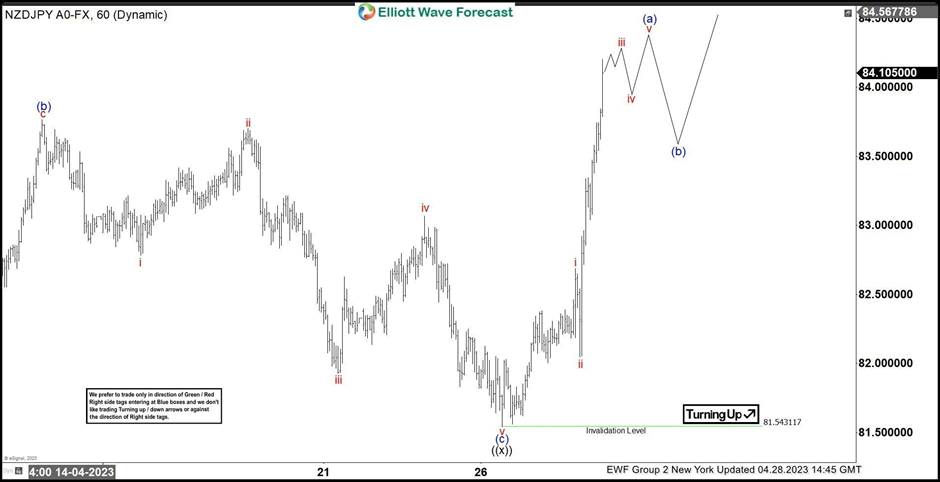
NZD/JPY Elliott Wave 1 hour chart 04.28.2023

NZDJPY made another leg down as proposed toward 81.69-81.27 area . Wave ((x)) connector completed at 81.54 low. The pair has found buyers and made very good reaction higher as we expected. As far as 81.5 pivot holds, more upside can be seen in the pair.

NZDJPY

Author

Elliott Wave Forecast Team

Elliott Wave Forecast Team

ElliottWave-Forecast.com

More from Elliott Wave Forecast Team
Share:

Editor's Picks

EUR/USD slips under 1.1800 on strong PMI data, Fed bets boost Dollar

EUR/USD drops for the second straight day down 0.49%, following last Friday’s metals rout which underpinned the Greenback to the detriment of the shared currency. Also the nomination of Kevin Warsh to lead the Federal Reserve and upbeat US economic data drove the pair lower. 

GBP/USD losses slow as BoE rate decision looms

The Pound Sterling (GBP) took another step lower amid a cautious stance against the US Dollar on Monday, easing back from recent multi-year highs as investors positioned ahead of a busy week of UK data and the Bank of England's first policy decision of 2026.

Gold rebounds; will it last?

Gold stages a comeback in Asian trades on Tuesday, after having found brief support near $4,650. The US Dollar uptrend stalls amid US-Iran de-escalation, easing US-India trade tensions and data disruption. Gold fails to close Monday above the 21-day SMA, but RSI recaptures the midline on the daily chart.

Top Crypto Gainers: Stacks, MemeCore, and Kaia rebound from critical support levels

Stacks (STX), MemeCore (M), and Kaia (KAIA) led the broader cryptocurrency recovery over the last 24 hours as bulls resurfaced after a bearish week, driven by the White House meeting on the crypto market structure bill on Monday.

Macro outlook improves despite the geopolitics

In the headlines, geopolitical have overshadowed an otherwise benign macro environment in early 2026. While market jitters around the US intervention in Venezuela and the sudden tariff threats over the control of Greenland faded quickly, the events have left a sense of unease of what might come next. 

Ripple steadies after sell-off as low on-chain activity, retail interest weigh

XRP rebounds from last week’s support at $1.50 but struggles below resistance at $1.77. Active addresses on the XRP Ledger dropped below 18,000 on Sunday amid risk-averse sentiment. Retail interest in XRP continues to decline, with futures Open Interest dropping to $2.81 billion.