NY Fed Study Shows Household Spending Projections Continue to Slide
Every month, the New York Fed conducts a household survey of consumer expectations. Let's investigate the data.
The New York Fed Center for Microeconomic Data released its Survey of Consumer Expectations for December 2017.
The consumer survey is a one-year look ahead study of consumer expectations about inflation, home prices, jobs, and spending.
Here are some charts from the study.
Inflation Expectations
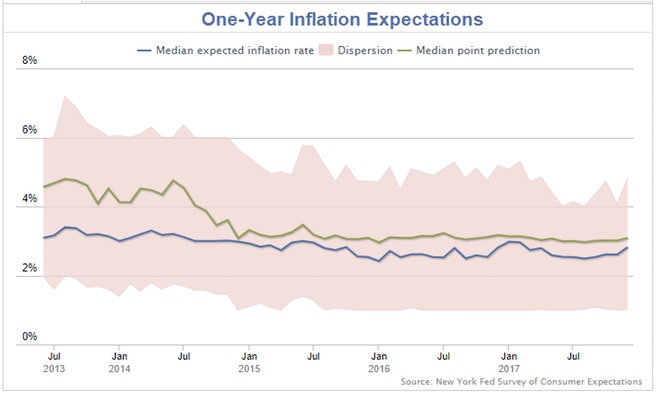
Inflation expectations are useless. The Fed believes in them as do most economic writer.
Earnings Expectations
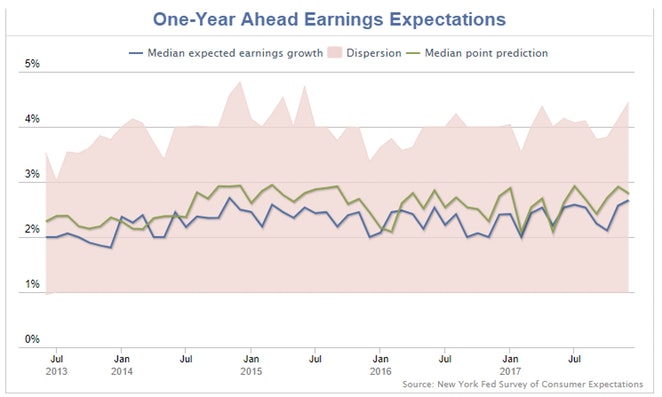
Earnings expectations have been relatively stable between 2 and 3 percent since 2014.
Moving Expectations
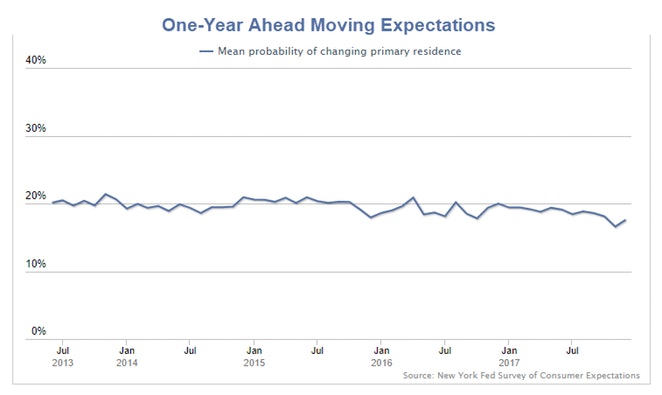
Moving expectations started trending lower in 2016 and slid for most of 2017. If accurate, this does not portend well for new and existing home purchases in 2018.
Unemployment Expectations
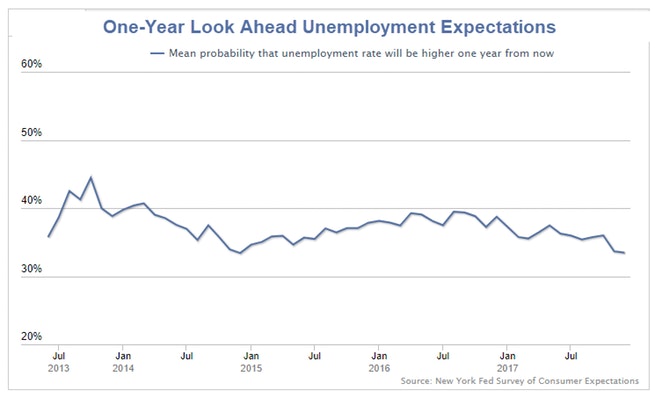
Unemployment expectations started trending lower in August of 2016. At this stage in the recovery, this trend is likely a contrarian indicator.
Household Finance Expectations
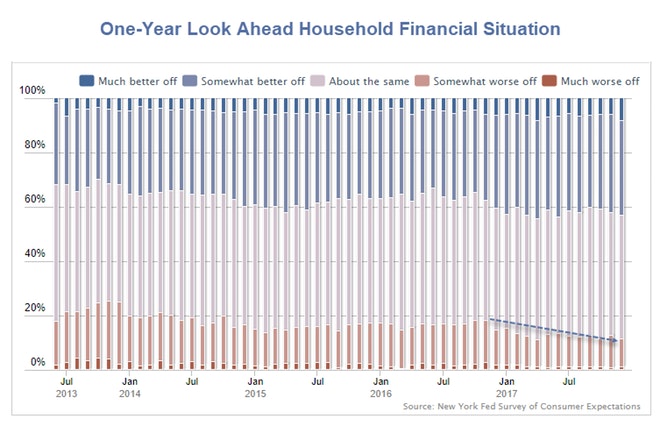
Once again, at this point in the recovery and with the stock market in a clear bubble, this is likely a contrarian indicator.
Household Spending Projections
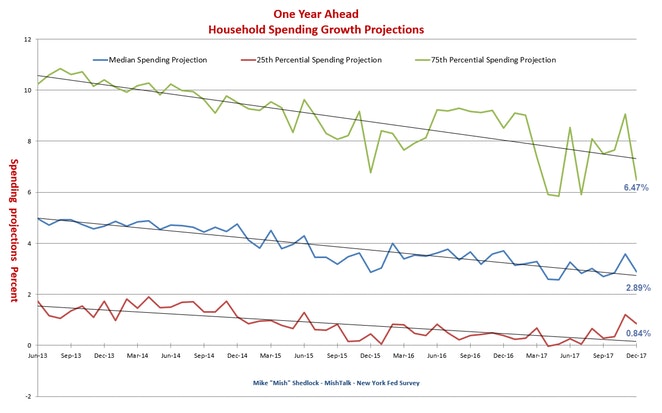
The New York Fed does not produce a good chart of spending projections so I downloaded the data to create the chart in Excel.
The trends on spending projections are very clear.
Household Spending Factors
-
Jobs - Neutral to Negative (The rate of job creation peaked in 2015. Minimum wage hikes will likely be at the expense of jobs)
-
Wage Growth - Neutral to Negative (Minimum wages are a plus, but it may be at the expense of jobs).
-
Stock Market Returns - Negative (The bubble is obvious and will likely burst in 2018)
-
Consumer Prices - Neutral to Negative (Unlike others, I see no major outbreak in prices. If oil declines as I expect, prices may come down or rise less).
-
Savings Rate - Negative (I expect the savings rate to increase. 24% of millennials are still paying 2016 Christmas bills!)
-
Moving - Negative (houses are not affordable and fewer people expect to move)
I find it curious, that when it comes to spending projections, the Fed places great faith in consumer confidence reports and none on its own survey.
Author

Mike “Mish” Shedlock's
Sitka Pacific Capital Management,Llc


