No steepening, just relentless bearish flattening of the yield curve plus inversions
The yield curve inverted in four places on Monday.
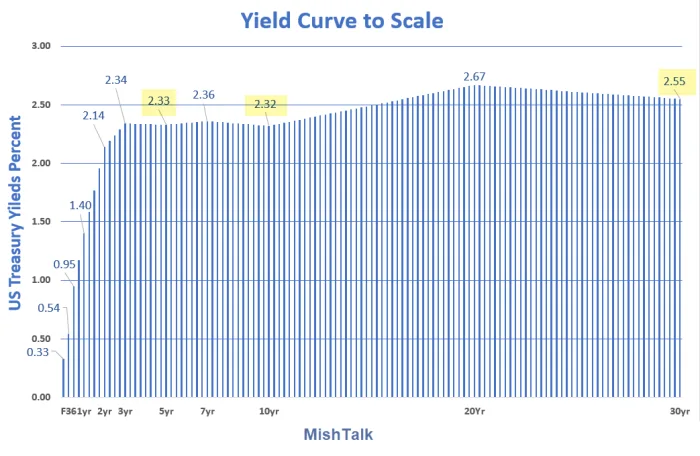
Yield Curve data from New York Fed as of March 21, chart by Mish
The yellow highlights mark spots where the curve is inverted.
Inversions happen when a shorter term treasury bill, note or bond yields more than a longer dated treasury.
Yield curve spreads since January 2022
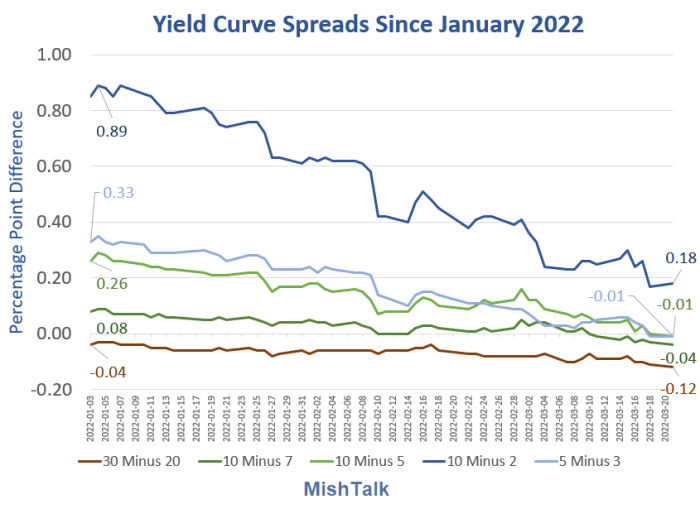
Yield Curve data from New York Fed, chart by Mish
The inversions are tiny but the curve is now inverted in four places.
Inversions are a recession signal, especially the 2-10 spread which is still positive by 18 basis points (BPs).
Inversions
- 20-30 Spread: -12 BPs
- 7-10 Spread: -4 BPs
- 3-5 Spread: -1 BP
- 5-10 Spread -1 BP
One Basis Point (BP) is .01 Percentage Point.
Bearish flattener
- Although spreads have collapsed, yields are rising.
- Shrinking spreads means flattening.
- Bearish means yields are rising.
Yield change on Monday
- 3-Month: +12 BPs
- 6-Month: +12 BPs
- 1-Year: +11 BPs
- 2-Year: +17BPs
- 3-Year: +19 BPs
- 5-Year: +19 BPs
- 7-Year: +19 BPs
- 10-Year: +18 BPs
- 20-Year: +14 BPs
- 30-Year: +13 BPs
Bond massacre
Despite the flattening, that is a bond massacre. The middle rising more than longer dated treasuries is a flattening process.
The Fed hiking the front end also causes flattening.
If the Fed hike 50 basis points (half-point hike) in May as some suspect, there there will be more inversions and flattening unless the long end also rises by a half point.
That is not the current pattern.
Steepener? Recession?
The bond market is not at all reacting in the manner of those expecting the curve to steepen in belief the Fed will do more Quantitative Tightening (QT).
For discussion, please see Why Does Anyone Have Faith in Fed Rate Hike and Inflation Expectations?
Also see Might We See a Minimal Job Loss Recession? Why Not?
Author

Mike “Mish” Shedlock's
Sitka Pacific Capital Management,Llc


