US Dollar: Sept USD is Up at 98.290.

Energies: Sept '19 Crude is Up at 56.40.

Financials: The Sept 30 year bond is Up 11 ticks and trading at 164.19.

Indices: The Sept S&P 500 emini ES contract is 20 ticks Higher and trading at 2928.75.

Gold: The Dec Gold contract is trading Up at 1512.20  Gold is 6 ticks Higher than its close.


Initial Conclusion

This is not a correlated market.  The dollar is Up+ and Crude is Up+ which is not normal and the 30 year Bond is trading Higher as well.  The Financials should always correlate with the US dollar such that if the dollar is lower then bonds should follow and vice-versa. The S&P is Higher and Crude is trading Higher which is not correlated. Gold is trading Higher which is not correlated with the US dollar trading Up.   I tend to believe that Gold has an inverse relationship with the US Dollar as when the US Dollar is down, Gold tends to rise in value and vice-versa. Think of it as a seesaw, when one is up the other should be down. I point this out to you to make you aware that when we don't have a correlated market, it means something is wrong. As traders you need to be aware of this and proceed with your eyes wide open.

Currently Asia is trading Mixed with half the exchanges Higher and the other half Lower.  At this time Europe is trading Mixed as well.  


Possible Challenges To Traders Today

  • No Major Economic News.

  • Lack of Major Economic news

Treasuries

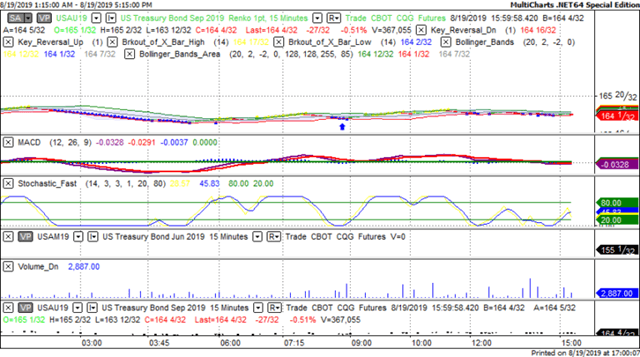
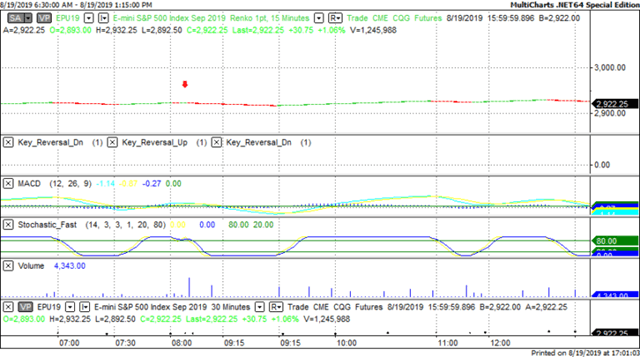
We've elected to switch gears a bit and show correlation between the 30 year bond (ZB) and The YM futures contract.  The YM contract is the DJIA and the purpose is to show reverse correlation between the two instruments.  Remember it's liken to a seesaw, when up goes up the other should go down and vice versa.

Yesterday the ZB made a major move at around 8:30 AM EST.  The ZB hit a Low at around that time and the YM hit a High.  If you look at the charts below ZB gave a signal at around 8:30 AM EST and the YM was moving Lower at the same time. Look at the charts below and you'll see a pattern for both assets. ZB hit a Low at around 8:30 AM and the YM was moving Lower at the same time.  These charts represent the newest version of MultiCharts and I've changed the timeframe to a 15 minute chart to display better.  This represented a Long opportunity on the 30 year bond, as a trader you could have netted about 20 ticks per contract on this trade.  Each tick is worth $31.25.  Please note: the front month for both the ZB and YM contract is now September, 2019 and I've changed the format to Renko bars such that it may be more apparent and visible.

Charts Courtesy of MultiCharts built on an AMP platform Click on an image to enlarge it.

ZB


YM


Bias

Yesterday we gave the markets an Upside bias as the Bonds and Gold were both trading Lower Monday morning and this usually reflects an Upside day.  The markets didn't disappoint as the Dow rose by 250 points and the other indices gained ground as well.  Today we aren't dealing with a correlated market and our bias is Neutral.

Could this change? Of Course.  Remember anything can happen in a volatile market. 


Commentary

Yesterday we didn't have any economic reports to speak of and the markets had to rely on its own devices for direction.  We gave the markets an Upside bias as both the Bonds and Gold were trading Lower and this usually reflects an Upside Day plus all of Europe was trading Higher as well.  Today we have no economic news to speak of.  We do have an FOMC Member speaking but he won't be doing so until 6 PM EST, two hours after the markets close hence there isn't any economic news to drive the markets to one direction or another.

Trading performance displayed herein is hypothetical. The following Commodity Futures Trading Commission (CFTC) disclaimer should be noted.

Hypothetical performance results have many inherent limitations, some of which are described below. No representation is being made that any account will or is likely to achieve profits or losses similar to those shown.

In fact, there are frequently sharp differences between hypothetical performance results and the actual results subsequently achieved by any particular trading program. One of the limitations of hypothetical performance trading results is that they are generally prepared with the benefit of hindsight.

In addition, hypothetical trading does not involve financial risk, and no hypothetical trading record can completely account for the impact of financial risk in actual trading. For example, the ability to withstand losses or to adhere to a particular trading program in spite of trading losses are material points which can also adversely affect actual trading results.

There are numerous other factors related to the markets in general or to the implementation of any specific trading program which cannot be fully accounted for in the preparation of hypothetical performance results and all of which can adversely affect actual trading results.

Trading in the commodities markets involves substantial risk and YOU CAN LOSE A LOT OF MONEY, and thus is not appropriate for everyone. You should carefully consider your financial condition before trading in these markets, and only risk capital should be used.

In addition, these markets are often liquid, making it difficult to execute orders at desired prices. Also, during periods of extreme volatility, trading in these markets may be halted due to so-called “circuit breakers” put in place by the CME to alleviate such volatility. In the event of a trading halt, it may be difficult or impossible to exit a losing position.

Recommended Content


Recommended Content

Editors’ Picks

USD/JPY holds near 155.50 after Tokyo CPI inflation eases more than expected

USD/JPY holds near 155.50 after Tokyo CPI inflation eases more than expected

USD/JPY is trading tightly just below the 156.00 handle, hugging multi-year highs as the Yen continues to deflate. The pair is trading into 30-plus year highs, and bullish momentum is targeting all-time record bids beyond 160.00, a price level the pair hasn’t reached since 1990.

USD/JPY News

AUD/USD stands firm above 0.6500 with markets bracing for Aussie PPI, US inflation

AUD/USD stands firm above 0.6500 with markets bracing for Aussie PPI, US inflation

The Aussie Dollar begins Friday’s Asian session on the right foot against the Greenback after posting gains of 0.33% on Thursday. The AUD/USD advance was sponsored by a United States report showing the economy is growing below estimates while inflation picked up.

AUD/USD News

Gold soars as US economic woes and inflation fears grip investors

Gold soars as US economic woes and inflation fears grip investors

Gold prices advanced modestly during Thursday’s North American session, gaining more than 0.5% following the release of crucial economic data from the United States. GDP figures for the first quarter of 2024 missed estimates, increasing speculation that the US Fed could lower borrowing costs.

Gold News

Ethereum could remain inside key range as Consensys sues SEC over ETH security status

Ethereum could remain inside key range as Consensys sues SEC over ETH security status

Ethereum appears to have returned to its consolidating move on Thursday, canceling rally expectations. This comes after Consensys filed a lawsuit against the US SEC and insider sources informing Reuters of the unlikelihood of a spot ETH ETF approval in May.

Read more

Bank of Japan expected to keep interest rates on hold after landmark hike

Bank of Japan expected to keep interest rates on hold after landmark hike

The Bank of Japan is set to leave its short-term rate target unchanged in the range between 0% and 0.1% on Friday, following the conclusion of its two-day monetary policy review meeting for April. The BoJ will announce its decision on Friday at around 3:00 GMT.

Read more

Majors

Cryptocurrencies

Signatures