Nifty – forecasting the rally from Elliott Wave blue box

Nifty saw a high of 11794.25 at the end of August and then turned lower, we told members the decline should be corrective and present another opportunity for the buyers to enter the market. In this article, we will look at how the decline unfolded and also view the blue box area that we highlighted as the area for 3 waves pull back to end and then rally to resume in wave ((5)) or a 3 waves reaction higher to take place at least. Let’s look at some charts of Nifty below.
Nifty 1 hour elliott wave analysis – 23 September 2020
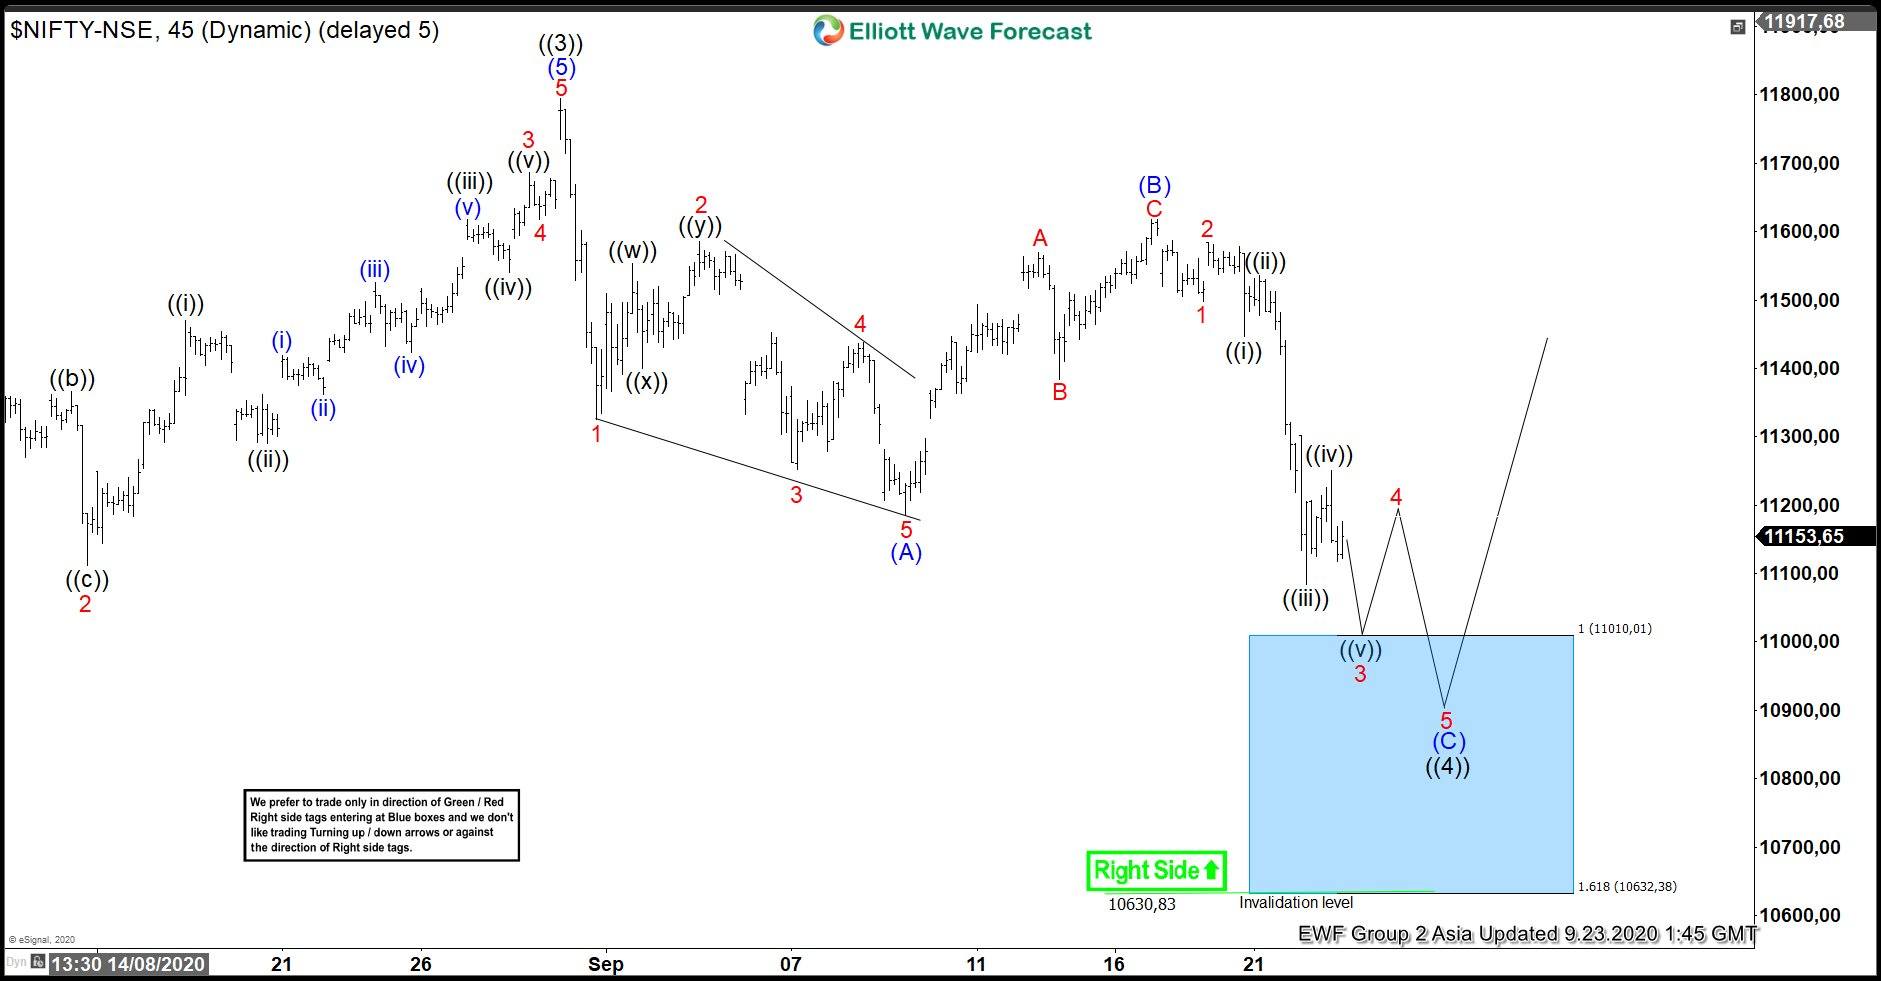
Chart below shows Nifty completed wave ((3)) at 11794.25 and them pull back in an overlapping structure to 11185.15 which we labelled as wave (A). This was followed by a 3 waves bounce to 11618.10 which we labelled as wave (B). Down from there, wave 1 completed at 11498.50, wave 2 completed at 11584.10, wave ((i)) of 3 completed at 11446.10, wave ((ii)) of 3 completed at 11535.25, wave ((iii)) and ((iv)) were also proposed to be over and preferred view called for 2 more lows to complete wave (C) in the blue box area (11010 – 10632) to complete wave ((4)). Blue Boxes are High-Frequency areas which are based in a relationship of sequences, cycles and calculated using extensions. We refer to them as High Frequency trading areas, we prefer blue boxes to enter in direction of the trend because blue Boxes are areas where majority of the times, both buyers and sellers again in direction of next move for 3 swings at least and hence why they present high probability / low risk areas to enter the market in direction of the trend.
Nifty 1 hour elliott wave analysis – 29 September 2020
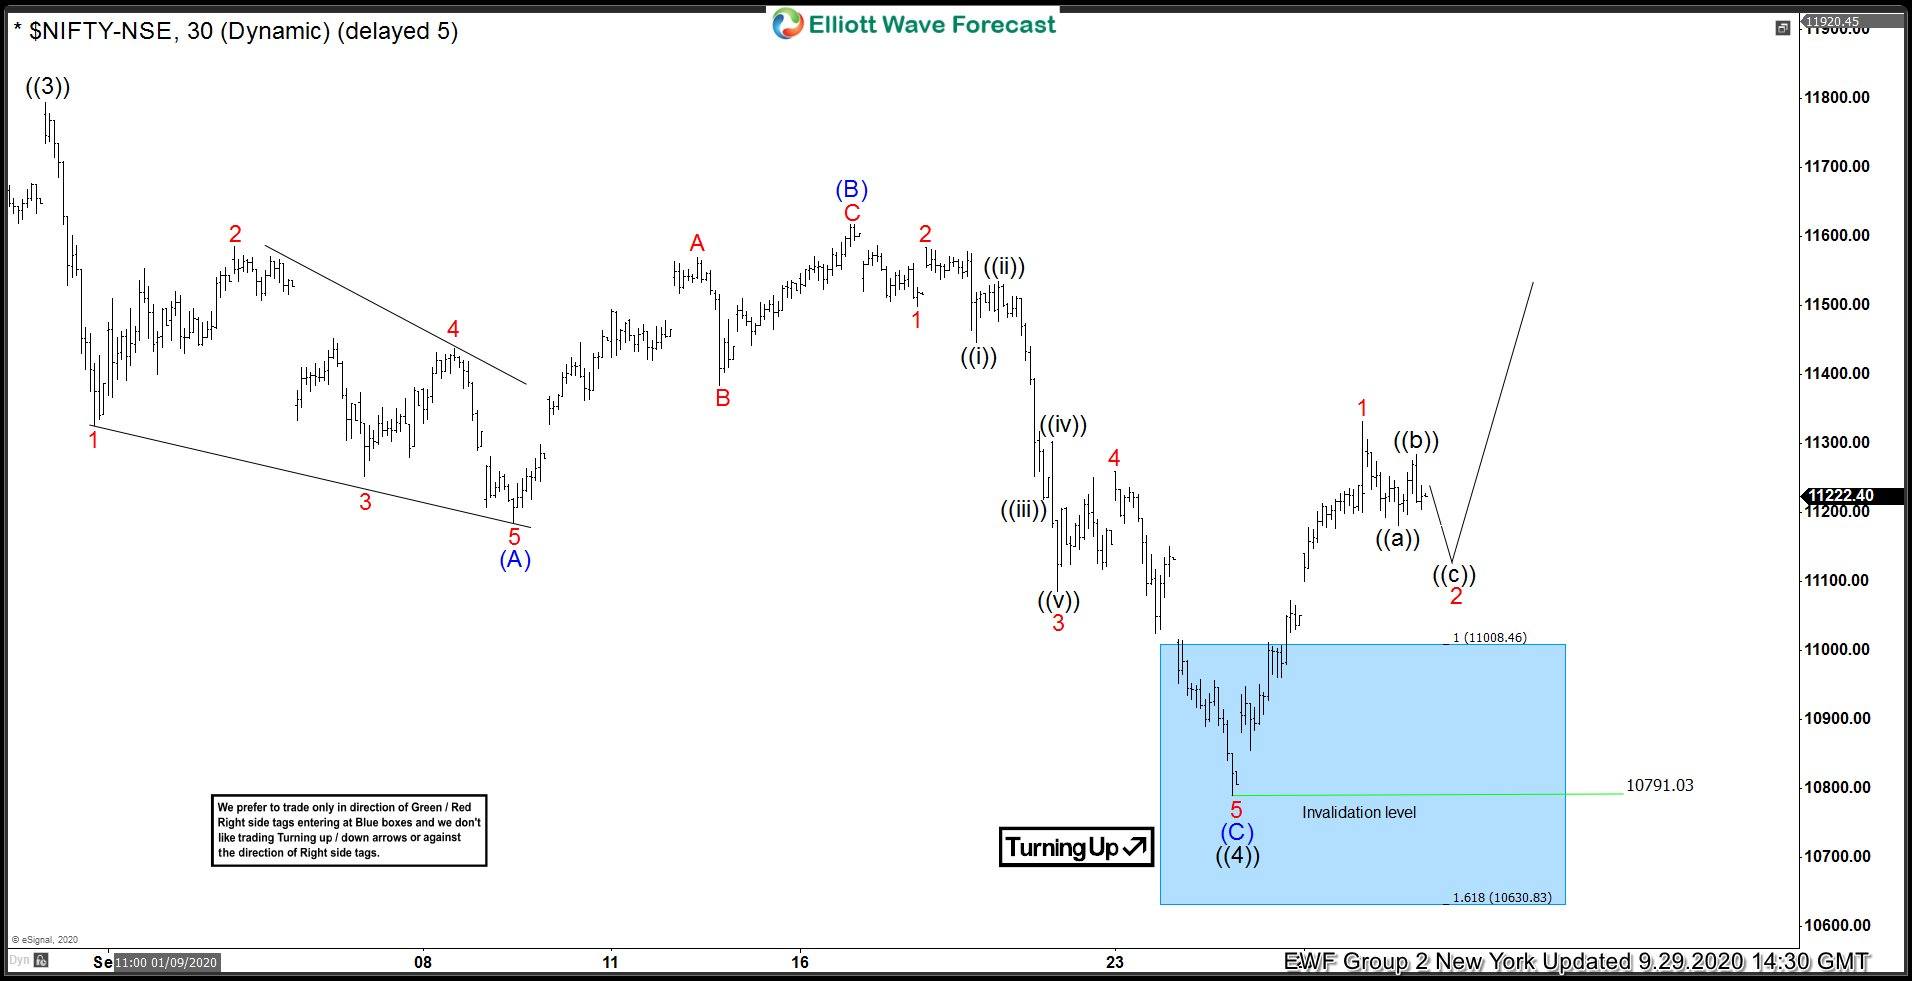
Chart below shows Nifty Index reached the blue box to complete proposed wave ((4)) at 10791.03 and reacted strongly higher. Reaction higher appears impulsive and has already crossed 50% retracement level (11204) of the decline from wave (B) and even exceeded the 61.8% retracement from (B) high. The reaction higher allowed any buyers which entered in the blue box to eliminate risk on the trade. We are calling wave 1 completed at 11239.55 and as pull backs hold above 10791, we expect Nifty Index to continue higher. A break of 10791 low can’t be ruled out and that will put the Index in a double correction lower from 11794.25, even if this scenario takes place, blue box did the job already and produced a reaction higher which should allow any buyers from blue box to get into a risk free position.
Author

Elliott Wave Forecast Team
ElliottWave-Forecast.com


