News Tsunami Propels Markets
US Dollar: Dec. USD is Down at 93.625.
Energies: Dec Crude is Up at 55.59.
Financials: The Dec 30 year bond is Down 4 ticks and trading at 153.14.
Indices: The Dec S&P 500 emini ES contract is 14 ticks Lower and trading at 2581.50.
Gold: The Dec gold contract is trading Up at 1282.00. Gold is 38 ticks Higher than its close.
Initial Conclusion
This is not a correlated market. The dollar is Down- and Crude is Up+ which is normal and the 30 year Bond is trading Lower. The Financials should always correlate with the US dollar such that if the dollar is lower then bonds should follow and vice-versa. The indices are Lower and Crude is trading Up+ which is correlated. Gold is trading Up which is correlated with the US dollar trading Down-. I tend to believe that Gold has an inverse relationship with the US Dollar as when the US Dollar is down, Gold tends to rise in value and vice-versa. Think of it as a seesaw, when one is up the other should be down. I point this out to you to make you aware that when we don’t have a correlated market, it means something is wrong. As traders you need to be aware of this and proceed with your eyes wide open.
At this hour all of Asia is trading mainly Higher with the exception of the Shanghai exchange. As of this writing Europe is trading mainly Lower with the exception of the German Dax exchange which is fractionally Higher at this hour.
Possible Challenges To Traders Today
-
Building Permits are out at 8:30 AM EST. This is major.
-
Housing Starts is out at 8:30 AM EST. This is major.
Treasuries
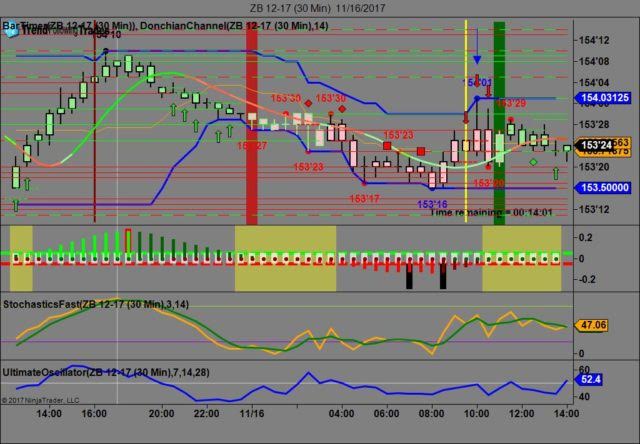
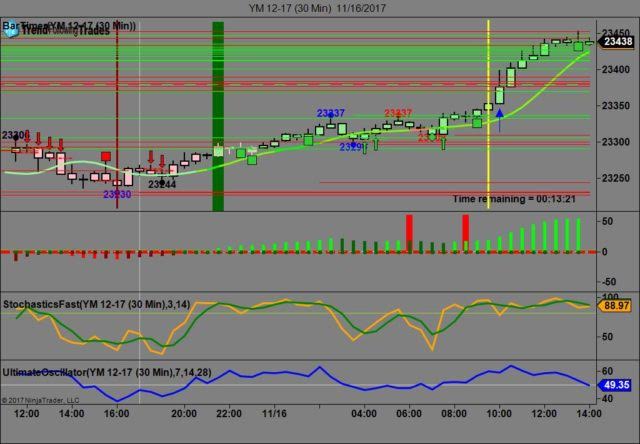
We’ve elected to switch gears a bit and show correlation between the 30 year bond (ZB) and The YM futures contract. The YM contract is the DJIA and the purpose is to show reverse correlation between the two instruments. Remember it’s liken to a seesaw, when up goes up the other should go down and vice versa.
Yesterday the ZB made it’s move at around 10 AM EST. The ZB hit a High at around that time and the YM hit a Low. If you look at the charts below ZB gave a signal at around 10 AM EST and the YM was moving Higher at the same time. Look at the charts below and you’ll see a pattern for both assets. ZB hit a High at around 10 AM and the YM hit a Low. These charts represent the newest version of Trend Following Trades and I’ve changed the timeframe to a 30 minute chart to display better. This represented a shorting opportunity on the 30 year bond, as a trader you could have netted about a dozen ticks per contract on this trade. Each tick is worth $31.25. We added a Donchian Channel to the charts to show the signals more clearly. Please note that the front month for the ZB and the YM contract is now December, 2017.
Charts Courtesy of Trend Following Trades built on a NinjaTrader platform.
Bias
Yesterday we called for an Upside bias as the Bonds and Gold were both trading lower and this usually reflects an upside day. The markets didn’t disappoint as the Dow climbed 187 points higher and the other indices gained ground as well. Today we aren’t dealing with a correlated market and our bias is Neutral.
Could this change? Of Course. Remember anything can happen in a volatile market.
Commentary
Yesterday we another boatload of economic news as there were about 9 reports, most of which were major. After a huge draw down on Wednesday, the markets reverted to its winning ways on Thursday. The Dow gained 187 points and the other indices gained ground as well. The NAHB housing market index showed strength coming in at 70 versus an expectation of 67. Today we have additional news on the housing markets with Building Permits and Housing Starts out at 8:30 AM EST.
Author

Nick Mastrandrea
Market Tea Leaves


