New Zealand Q2 Employment Preview: Aggressive jump in unemployment?
- New Zealand Q2 jobs data to show a big jump in unemployment.
- Kiwi risks further falls on a poor employment show.
- Dollar weakness could likely cushion NZD/USD’s downside.

Despite having managed the coronavirus crisis relatively well, the economic costs of the virus resurgence and the subsequent impact on New Zealand’s (NZ) labor market cannot be written-off.
The second-quarter employment report is set to show an aggressive jump in the unemployment this Wednesday at 2245 GMT. With the Reserve Bank of New Zealand (RBNZ) adapting its monetary policy settings to “maintain price stability and support maximum sustainable employment”, a worse-than-expected report could prompt the central bank to expand its quantitative easing (QE) programme or steer the key rates into the negative territory.
The unemployment rate is expected to have leapt to 5.8% in the three months to June after rising to 4.2% in Q1. Employment in the country is likely to have fallen by 2.0% when compared to a 0.7% rise seen in the previous quarter. The participation rate is seen ticking lower to 69.8% vs. the previous 70.4%. The labor cost index is expected to have increased by 0.3% QoQ and by 1.9% YoY.
The sluggish employment data could boost the dovish RBNZ expectations and exacerbate the pain in the kiwi. Although the reaction to the outcome is likely to be short-lived, as the risk-sensitive NZD will continue to remain at the mercy of the market mood and US dollar dynamics.
Recall that the RBNZ left the Cash Rate unchanged at a record low of 0.25% for the second straight month in June while maintaining its QE programme size at around NZD60 billion.
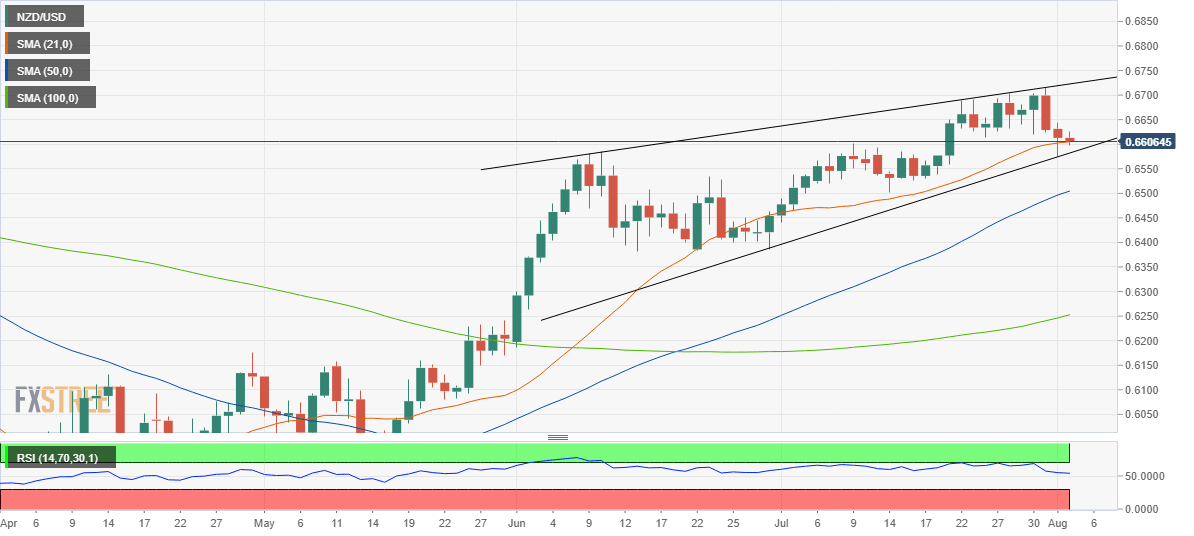
NZD/USD Technical outlook
NZD/USD is on a decent over the last couple of trading sessions, following a failure to resist above the 0.6700 level. Despite the weakness, the price keeps its range within a rising wedge formation on the daily chart, which has a natural tendency of a breakdown.
Should the data disappoint the market forecasts, the Kiwi could likely see a technical break of the rising trendline support at 0.6582. Although a daily close below the latter is critical to validate the pattern. The bullish 50-day Simple Moving Average (DMA) at 0.6505 could rescue the bulls if the selling pressure intensifies.
On the flip side, daily closing above the 21-DMA at 0.6605 could call for a bounce towards Monday’s high of 0.6644 en route the 0.6700 round figure. The daily Relative Strength Index (RSI) points south but holds above the midline, suggesting limited scope for the downside.
NZD/USD Daily chart
Premium
You have reached your limit of 3 free articles for this month.
Start your subscription and get access to all our original articles.
Author

Dhwani Mehta
FXStreet
Residing in Mumbai (India), Dhwani is a Senior Analyst and Manager of the Asian session at FXStreet. She has over 10 years of experience in analyzing and covering the global financial markets, with specialization in Forex and commodities markets.


