New profitable call on natural gas: The yoyo-trade is back

Gas prices surged in stride and then the market plunged back down like a yoyo thrown from a balcony. What caused such a reaction?
At the beginning of the week, Henry Hub natural gas futures closed above the $4 psychological mark on the NYMEX for the first time this new year as a result of robust US LNG exports and weather-driven demand. Overall, the prices on the February contract were still trading on a longer-term downtrend, which is why I was especially looking for the best spot to initiate a short-selling trade rather than jumping on a galloping horse.
Meanwhile, some of our subscribers – always free to scalp the market (or to take more aggressive counter-trend trades towards our suggested entries) – were just getting ready to go short around the $4.876.5.079 resistance zone (highlighted by a yellow band), with a stop placed just above the higher $5.400 level (represented by a red dotted line) and targets at $4.568 and $4.213 (also marked by two green dotted lines), according to my last projections.
As a result, gas prices indeed surged in stride (performing a high-speed rally up to the 4.879 that got almost immediately stopped by the yellow band – thus triggering our entry). It was just before the market plunged back down like a yoyo thrown from the third floor and wheeling on the first-floor balcony, considering our targets to be located on both the second and first floors.
This sudden reversal move was certainly triggered on the one hand, technically by aggressive traders taking profits, but also , more fundamentally, by a slowdown in gas demand as the purchases for colder weeks were already anticipated by the commercials (large MNCs hedging their risk, oil and gas majors, utility companies, etc.); the latter having undoubtedly more impact and weight than we, or larger speculators, on those markets. Thus, I would say the key is trying to think like them to get some understanding of trading energies.
Trading charts
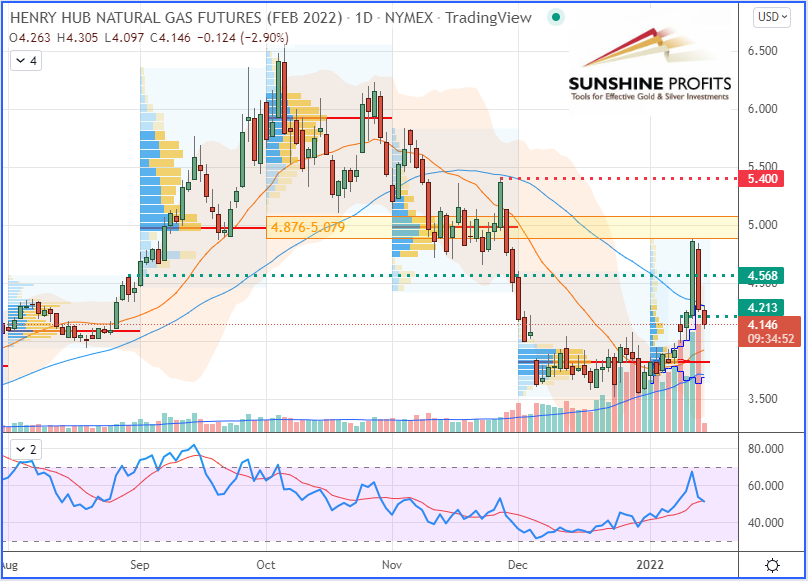
Chart – Henry Hub Natural Gas (NGG22) Futures (February contract, daily chart)
Now, let’s zoom into the 4H chart to observe the recent price action all around the above mentioned levels of our trade plan:
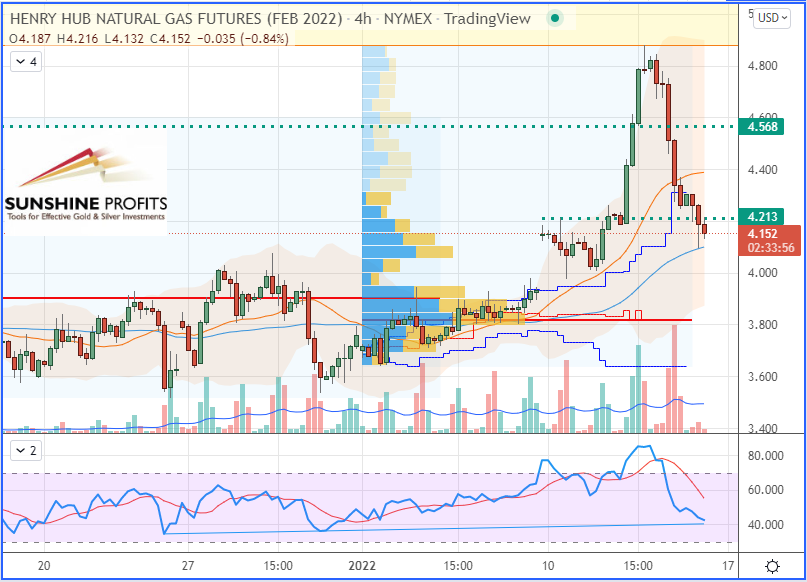
Chart – Henry Hub Natural Gas (NGG22) Futures (February contract, 4H chart)
Want free follow-ups to the above article and details not available to 99%+ investors? Sign up to our free newsletter today!
Want free follow-ups to the above article and details not available to 99%+ investors? Sign up to our free newsletter today!
Author

Sébastien Bischeri
Sunshine Profits
Sebastien Bischeri is a former Reserve Officer in the French Armed Forces (Navy), and began his career in computer science and engineering, prior to move into banking, finance, and trading.


