New homes for sale is a poor measure of supply, what's the real supply?

Let's take a look at the supply of new homes as well as total housing units under construction.
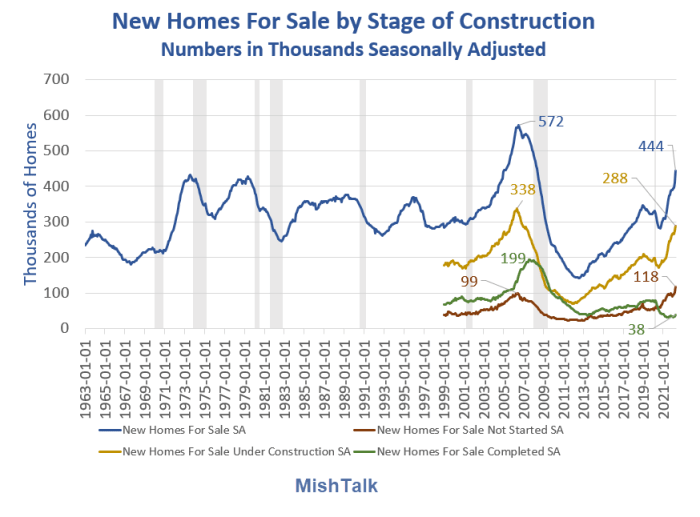
New homes for sale data from commerce department, chart by Mish
The commerce department released its new residential constructing report today.
Allegedly there is a 9 months supply of new homes for sale.
New homes for sale supply
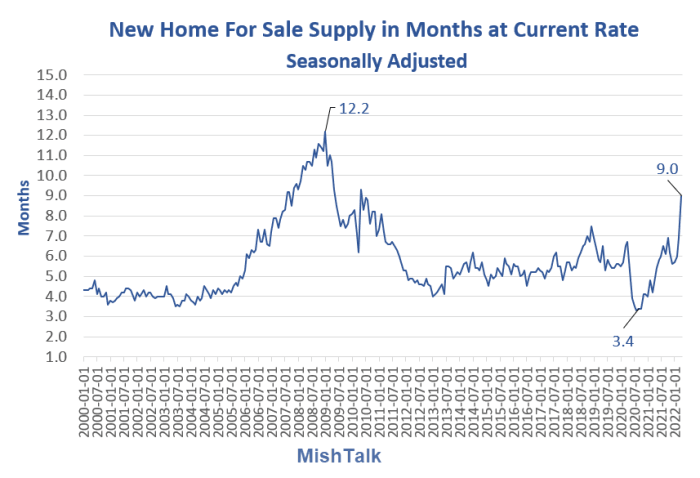
New homes for sale data from commerce department, chart by Mish
New Home Sales
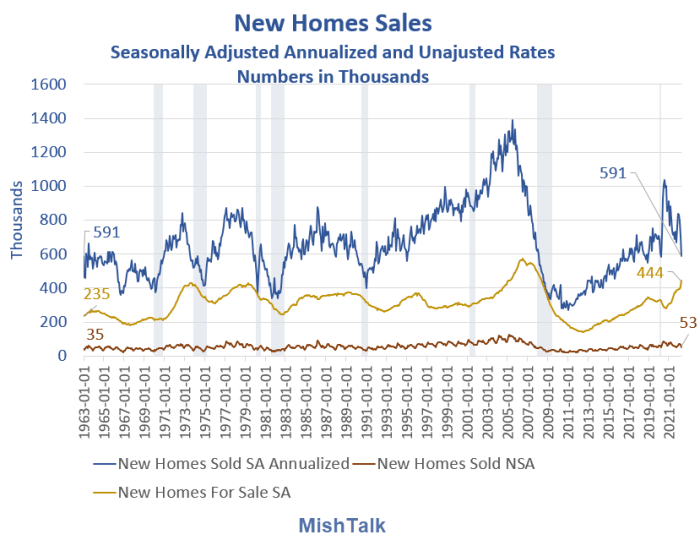
New homes data from commerce department, chart by Mish
Understanding the month's supply calculation
The seasonally‐adjusted estimate of new houses for sale at the end of April was 444,000. This represents a supply of 9.0 months at the current sales rate.
444,000 for sale / 591,000 sold * 12 = 9.0 Months.
Key points
- Of the alleged 444,000 homes for sale, 118,000 have not been started. Instead, builders sit on land, hoping for sales contracts. That's a record number of homes for sale that may not be started for many months or even years in this environment.
- There are only 38,000 actual completed homes for sale. Even at depressed sales rates, that's miniscule supply.
- Arguably a better way of looking at for sale is a measure of completed homes plus homes under construction as a percentage of sales.
326,000 for sale (started or completed) / 591,000 sold * 12 = 6.6 Months.
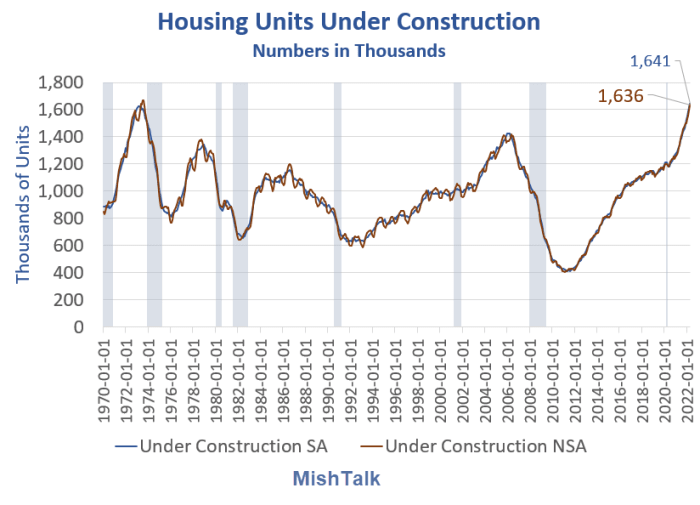
Total units under construction
Rent matters more to the Fed
Rent matters far more to the Fed than home prices. Home prices are not even in the CPI.
The Fed desperately wants the price of rent to decline and the record number of units under construction will help.
Key shelter points
- OER is 23.816% of the CPI in April.
- Rent is 7.278% of the CPI in April.
- Year-over-year rent was only up 3.8% in January and 4.8% in April.
- Year-over-year OER was only up 4.1% in January and 4.8% in April.
OER is the mythical price one would pay to rent one's own house from himself, unfurnished, and without utilities.
OER and rent make up over 31 percent of the CPI. The best chance for the CPI to stabilize is if the price of rent declines.
Hiking rates will slow the construction of housing, including multi-family. But the massive supply of total housing units under construction puts downward pressure on rents.
In addition the 288,000 new homes for sale and under construction puts downward pressure on new home prices.
Meanwhile, however, it's highly unlikely that rent only went up 4.8% in April. That will put short-term upward pressure on the CPI.
Longer term, boomer downsizing and eventual deaths will greatly add to supply.
CPI year-over-year drops a bit, but is it believable?
The CPI rose again in April, more than economists expected. Year-over-year there's a small decline.
I question the rent numbers thus, the entire CPI.
For discussion, please see CPI Year-Over-Year Drops a Bit, But Is it Believable?
For more discussion of housing, please see New Home Sales Plunge 22.5% In April, 16.6% From Deep Negative Revisions.
Finally, we had evidence that today's huge plunge in new home sales was coming.
Yesterday, I commented NAR Pending Home Sales Data Provides More Evidence of a Severe Housing Slump.
And on May 23, I noted The NAHB Wells Fargo Home Builder's Index Is Sinking Spectacularly.
Author

Mike “Mish” Shedlock's
Sitka Pacific Capital Management,Llc


