Nascent ABC Wave Signals More Slips for the Loonie
Key Points:
-
Potential ABC wave could see another surge lower in the coming days.
-
The pair should now retrace for the B leg in the near-term.
-
Could reach as low as the 1.30 handle.
As the Loonie continues to bounce between the constraints of its rising wedge, the pair offers some solid upside and downside potential for range traders. Currently, the pair is mid-way through onesuch tumble back to the downside. However, a near-term retracement could provide those who missed out on the initial plunge a second chance to net some pips.
As shown on the daily chart, after recently testing the upside constraint, the USDCAD has moved into a fairly steep decline. As a result of this, a significant portion of downside potential has already been realised which might discourage the Loonie bears out there from wading into the fray. Furthermore, the apparent slowing of the plunge to the bottom of the wedge is now hinting that the bulls should be making a comeback.
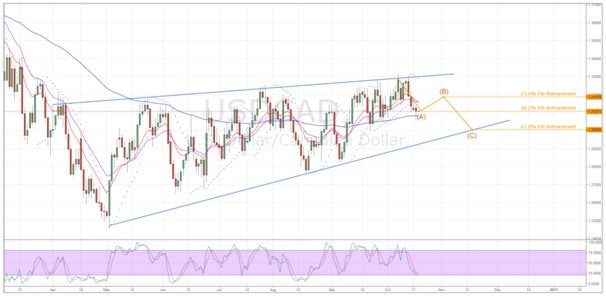
Fortunately, any near-term bullishness is likely to be short-lived given that the pair’s most recent slide is potentially taking the form of and ABC corrective wave. We expect to see the pair take a breather in the coming days, a result of the movement of stochastics into oversold territory. Moreover, the point at which the Loonie is seemingly struggling to breach coincides with the 38.2% Fibonacci level. When combined with the support being exerted by the 100 day EMA, these factors should encourage a rally from point A back up to the 1.3187 mark which will see the second leg of the ABC wave form.
After completing this second leg, point B should prove to be a zone of infection as the bearish Parabolic SAR begins to be felt once again. Additionally, the pair will have put some distance between itself and the 100 day EMA which will weaken the buoyancy being generated by the moving average. The movement of stochastics out of oversold territory will also make it substantiallyeasier for the Loonie bears to wrest control of the pair back from the bulls. However, where the subsequent tumble ends is still up for debate. If the USDCAD does manage to make it all the way back to the downside constraint, it will likely end leg C at the intersection of the 61.8% Fibonacci retracement and the lower boundary of the wedge.
Ultimately, fundamentals will also be in play this week, especially on the Canadian side of things. Specifically, any surprise changes to the Overnight Rate could seriously disrupt the emerging technical pattern and should, therefore, be watched very closely. However, in the absence of a major fundamental upset, the Loonie’s ABC wave could give a second chance to those who missed the initial plunge so keep an eye on the pair as the week progresses.
Author

Matthew Ashley
Blackwell Global Investments Limited
Matthew joined Blackwell Global in March 2016; he works as a currency analyst in the research department based in Auckland.


