Murrey math lines: Brent, SP 500

Brent
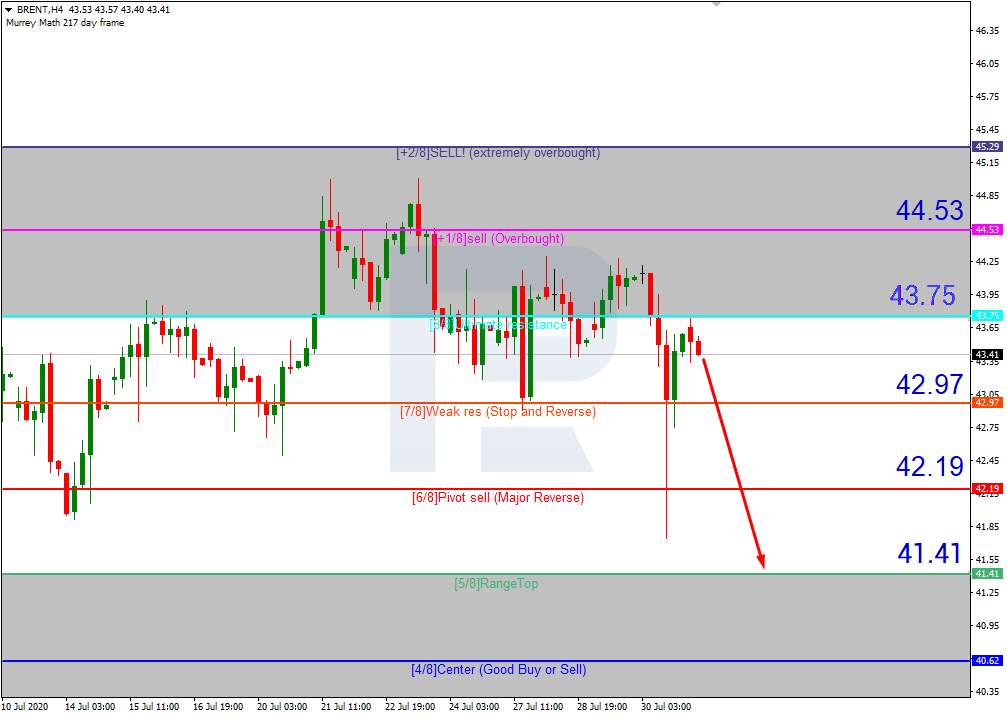
As we can see in the H4 chart, Brent has rebounded from 8/8. In this case, the price is expected to resume falling towards the support at 5/8. However, this scenario may no longer be valid if the price breaks 8/8 to the upside. After that, the instrument may continue growing to reach the resistance at +1/8.
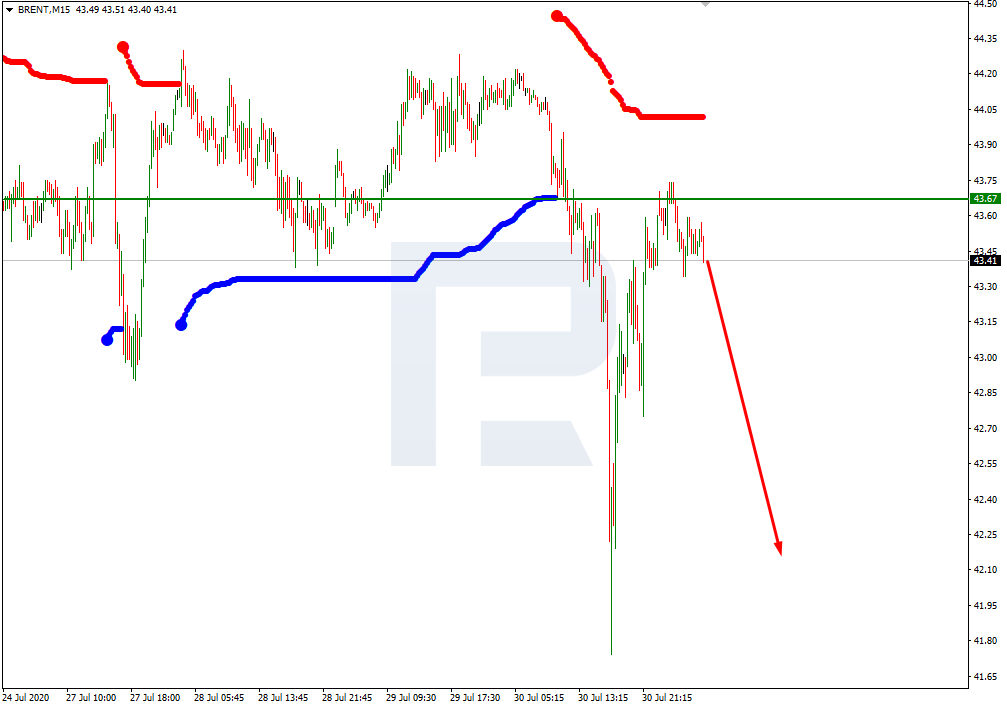
In the M15 chart, the asset may break the downside line of the VoltyChannel indicator and, as a result, continue the descending tendency.
SP 500
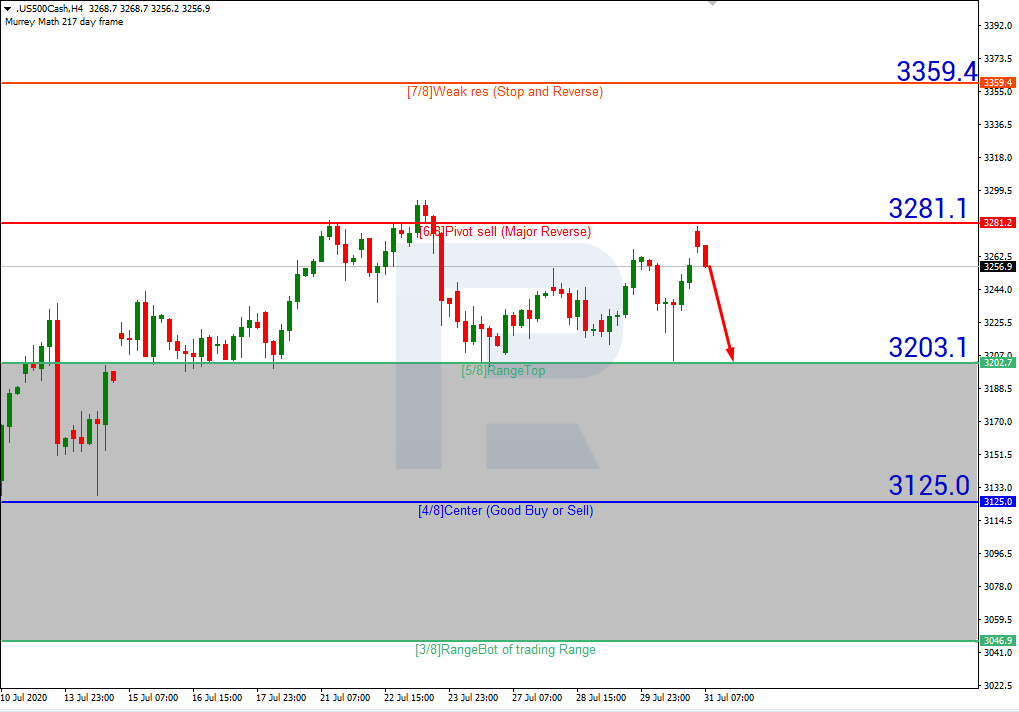
As we can see in the H4 chart, after rebounding from 6/8 again, the Index is expected to start another decline towards 5/8. However, this scenario may no longer be valid if the price breaks 6/8 to the upside. After that, the instrument may resume growing towards the resistance at 7/8.
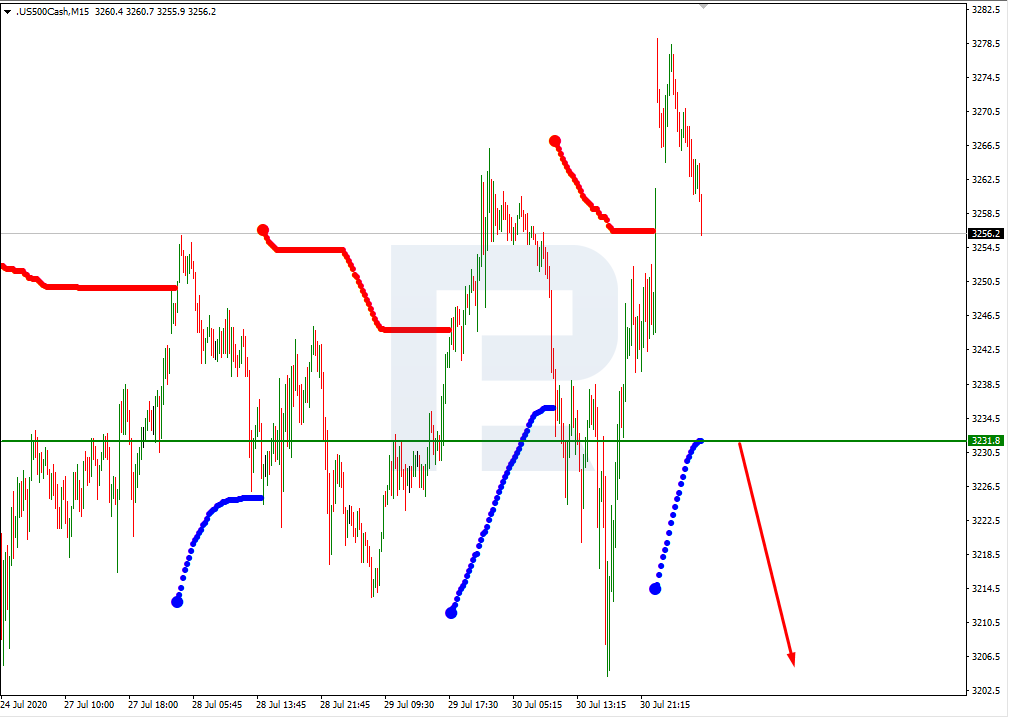
In the M15 chart, the asset may break the downside line of the VoltyChannel indicator and, as a result, continue trading downwards.
Author

RoboForex Team
RoboForex
RoboForex Team is a group of professional financial experts with high experience on financial market, whose main purpose is to provide traders with quality and up-to-date market information.


