Moon And Sun Rally The S&P
Chaos Clinic for 11/8/2019
Last weekend when I perused this week with my graphical ephemeris, looking for Moon transits that might move the S&P, I noticed one interesting one near 2:00 Eastern on November 7th. It was a transit that I have seen near major tops many times. I look for times when high energy harmonic moves could occur.
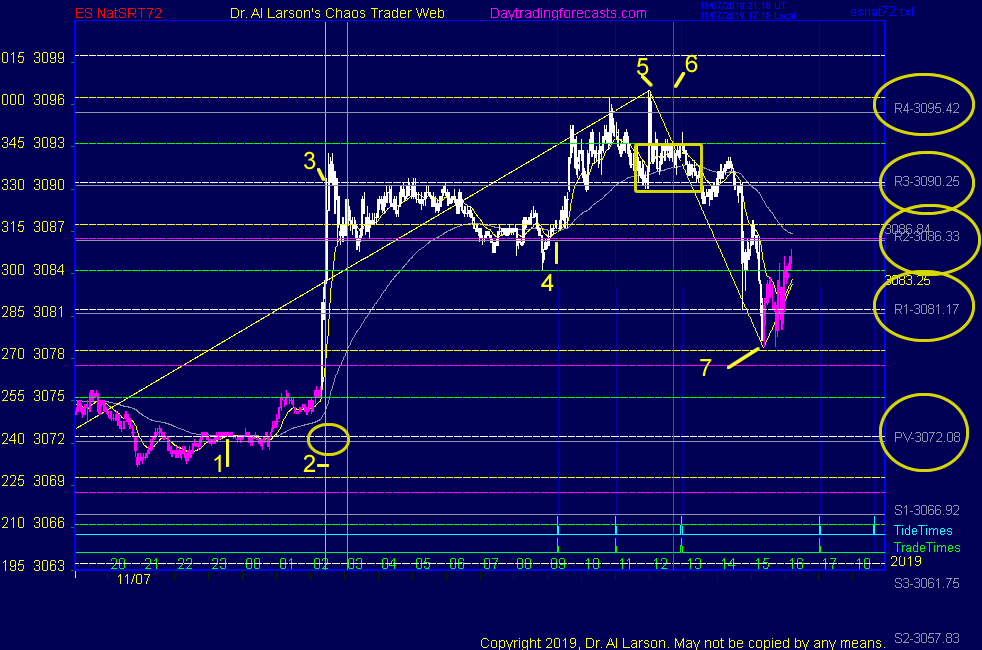
This chart shows how it turned out. This chart is the esNat72 chart from the Secret page on daytradingforecasts.com. That site is available to subscribers of my Tomorrow's Market Hotline Email.
The scale on the left of this chart is scaled to a Wheel of 72 points per circle. The left column of numbers are the degrees corresponding to price. For example,
prices moved from about 240 degrees to 0 degrees, above which the scale repeats. The horizontal axis is a 24 hour session with 24 hour time marked as Eastern.
There are two sets of horizontal lines on the chart, vibration levels, and pivot prices. the vibration levels are 4 sets of lines, white, green, magenta, and white. Each set of lines repeats every 9 points, the eighth harmonic of 72.
The pivot prices are labeled on the right of the chart, as S4,S3,S2,S1,Pivot,R1,R2,R3, and R4. These prices are computed from the prior day's data, and represent harmonic levels that connect today's prices with the prior days. These levels are widely used by computer trading algos.
Near the bottom of the chart are two lines of "pippers" for the MoonTide TideTimes and TradeTimes. Also shown on the chart are vertical lines representing times of significant Moon activity. The position and number of these lines varies every day as the Moon moves.
I have put numbers on the chart for descriptive purposes. These have nothing to do with any method of wave counting.
For the first six hours prices traded near the Pivot price, at point 1. This was along a white vibration level. Then at point 2, prices shot up 2 white levels to 3. This is an 18 point move, one fourth of the Wheel of 72. It also corresponded to a move from the pivot price PV to R3. From there prices congested between R2 and R3 until the normal session open at point 4.
In the normal session, prices rallied up two yellow levels to point 5. En route prices made a small "three drives to a top. " The last drive was a vertical move from the white level to the yellow level, basically up 9 points from the yellow level near point 4. Within minutes, prices dropped back below the
green level. Then for over an hour prices traded withing the yellow box.
This action is "range halving." It is a form of frequency doubling, a well known precursor to chaos. That suggested that the vertical green line at 6 could reverse the trend. That is what happened, as prices dropped two yellow levels to point 7. The move down was again an 18 point move, one fourth of the Wheel of 72.
The evening news said the rally was due to news on US-China trade negotiations. But my research says there are hidden forces at work. The move at 2 and 3 was a Moon influence. Point 5 was exactly when the Sun passed over the New York Stock exchange. So the Moon and Sun provided the energy for the rally. It was the earth's electric field and the rules of harmonic energy addition that were the hidden forces.
For more on my work, see Moneytide.com
This content was published on Dr. Al Larson's Chaos Clinic which you can attend each Friday for free.
Dr. Al Larson has developed a complete Chaos Model of Markets, four unique courses that let you become a Certified Chaos Trader, some very unique eMylar fractal pattern overlays, and tools that permit forecasting individual stocks and markets years in advance. You can also sign up for a free weekly email, and attend a free Chaos Clinic on Fridays. To learn more, click on the author's profile.
Be sure to sign up for the free weekly email!
Author

Dr. Al Larson, PhD
MoneyTide.com
Dr. Al Larson holds a Ph.D. in Electrical and Computer Engineering from the University of Wisconsin. He is a 1964 Distinguished Graduate of the U. S. Air Force Academy.


