Metals’ Reversals, Lower Prices and Our Precious Profits

Gold, silver, and mining stocks reversed practically exactly at their double triangle reversal point and the short positions that we opened along with taking profits off the table from the previous long positions, became profitable almost instantly. There’s quite a decline to catch here, and it seems that only a small part thereof had already taken place.
PMs Reversing

The above chart clearly shows how important the triangle reversals were recently. The two first reversals were local bottoms before the final part of the upswing, and the third one – confirmed by two separate reversals from silver and miners – marked the rally’s final top. This is likely the case with gold, crystal clear with silver, and it might not seem to be the case yet in case of the miners.
In fact, at first sight it may appear that the outlook for gold, silver, and mining stocks is bullish, because the decline in mining stocks is not very big and thus miners are actually showing strength. This is not necessarily the case.
It’s not one of the most popular gold trading techniques, but the mining stocks can have this tendency to show a kind of stillness (stiffness if you will) after the top, but they get back to their normal behavior shortly. Please note what happened on September 5th – on the first day of the September decline. Gold and silver took a big dive, but miners declined visibly less. Did it change anything? No. That was still a major top, and when silver’s initial slide turned then into a pause, miners caught up with the pace at which the metals had declined previously. Similar action is likely to follow also this time.
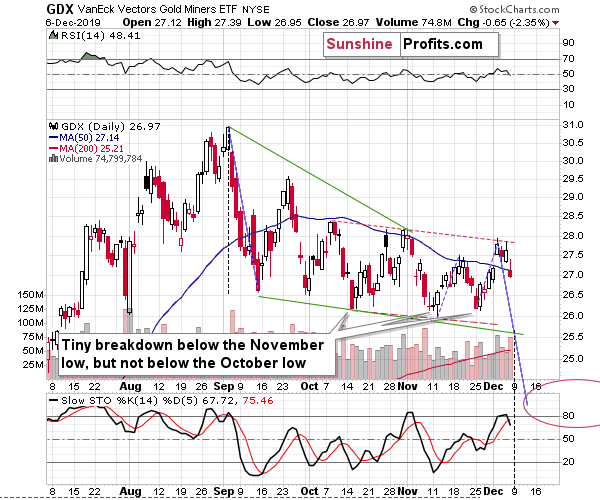
The GDX ETF declined back below the 50-day moving average and we saw a sell signal from the Stochastic indicator shortly after it reached above 80. That’s what confirmed both the early-November and the early-September tops. Moreover, please note that GDX’s Friday’s decline took place on big volume, which further validates the theory that the top for the recent decline is already in.
Moving to silver, please note that it ended the previous week at a price level that we haven’t seen since August.
Silver Also Hints at the Upcoming Decline
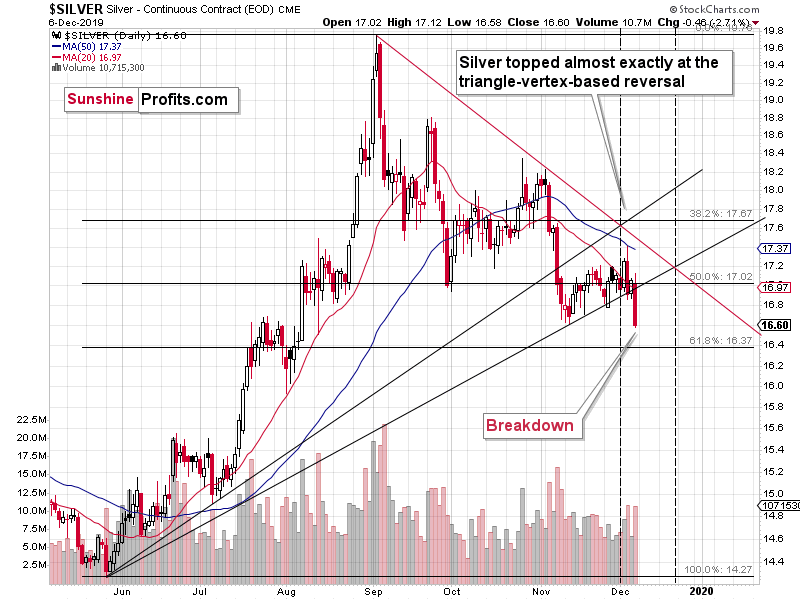
The breakdown below the November lows is confirmed by the weekly close and significant volume, but not yet by three consecutive daily closes. Still, given the fact that silver reversed almost exactly at its triangle-based reversal and after touching its 50-day moving average make the confirmation of breakdown very likely.
The nearest support levels are the intraday mid-August low, and the 61.8% Fibonacci retracement based on May – September rally. However, the decline to these levels would be relatively small. Too small. The two short-term declines that we saw in September and in November are at least twice as big as what we saw recently, and this means that if this rally is only to be “normal”, the move lower should be much bigger.
This means that silver is likely to decline further – likely below $16.
There’s a good reason to believe that this decline will be more than just twice of what it’s been so far.
The USD Index Throws Its Weight Behing the Coming Decline Too
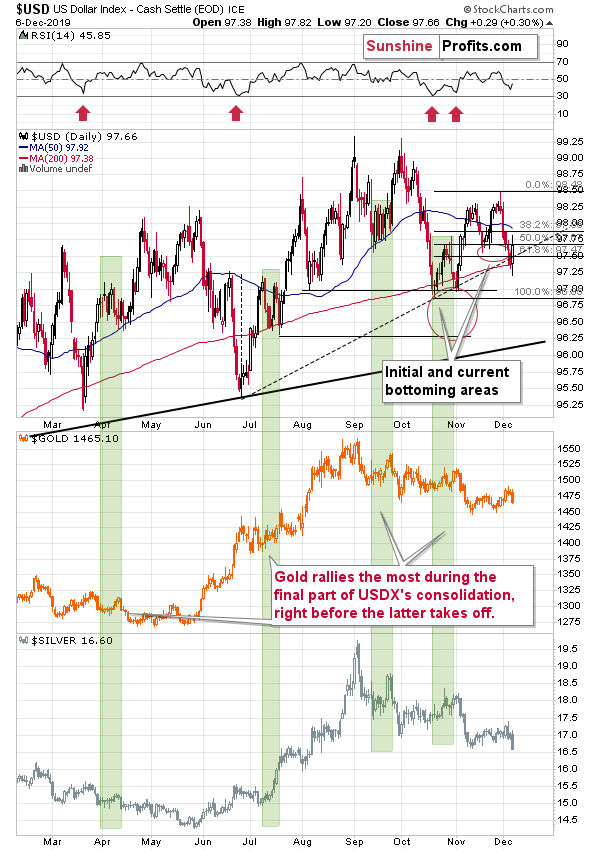
Gold and silver plunged in early November in response to soaring USD Index. Since that time, the USDX declined and moved relatively close to its early-November low. Neither gold, nor silver moved close to their early-November highs. All they did was to correct part of their November decline. It took just one daily upswing in the USD Index from the short-term lows to make silver break below its own November low.
The link between precious metals and the USDX strongly favors the continuation of metals’ weakness. If it wasn’t for the late-November and early-December decline in the USDX, both gold and silver would have probably already been trading at much lower price levels. USD’s pullback triggered a pause in the decline, which at the same time prepared the PMs for the next big downswing.
Gold and – especially – silver are already magnifying the bearish signs from the USDX, and it seems that they will get much more of them in the following day(s).
The USDX bottomed slightly below our target area (just one daily close below it) and it invalidated the breakdown below its rising support. Invalidations of breakdowns are strong bullish signs. We previously wrote that the invalidation of breakout that we saw in late-November was a bearish sign for the short term and indeed, a quick slide followed. We now saw something quite the opposite. The difference is that this time, the support that was not broken, is stronger. This means that this bullish invalidation is also more important than the previous bearish invalidation.
With soaring USD Index and the gold-silver-USD link in place that magnifies USD’s signals, the short-term outlook for the precious metals market looks very bearish. And it’s not too late to take advantage of it
Our profitable long precious metals position has been closed last week, and we’ve entered another trade immediately. This time, on the short side of the market, and it’s going profitable again. The full version of this analysis features the full details and targets of the already-profitable short, adjusted for current gold seasonality and long-term turning points with the supports ahead. Join us and profit along!
Want free follow-ups to the above article and details not available to 99%+ investors? Sign up to our free newsletter today!
Want free follow-ups to the above article and details not available to 99%+ investors? Sign up to our free newsletter today!
Author

Przemyslaw Radomski, CFA
Sunshine Profits
Przemyslaw Radomski, CFA (PR) is a precious metals investor and analyst who takes advantage of the emotionality on the markets, and invites you to do the same. His company, Sunshine Profits, publishes analytical software that any


