US Dollar: Jun. USD is Up at 90.850.

Energies: Jun '18 Crude is Up at 67.75.

Financials: The June 30 year bond is Down 18 ticks and trading at 141.31.

Indices: The June S&P 500 emini ES contract is 16 ticks Lower and trading at 2631.25.

Gold: The June gold contract is trading Up at 1325.60.  Gold is 74 ticks Lower than its close.

Initial Conclusion

This is not a correlated market.  The dollar is Up+ and Crude is Up+ which is not normal but the 30 year Bond is trading Lower.  The Financials should always correlate with the US dollar such that if the dollar is lower then bonds should follow and vice-versa. The S&P is Lower and Crude is trading Higher which is correlated. Gold is trading Down-  which is correlated with the US dollar trading Up+.   I tend to believe that Gold has an inverse relationship with the US Dollar as when the US Dollar is down, Gold tends to rise in value and vice-versa. Think of it as a seesaw, when one is up the other should be down. I point this out to you to make you aware that when we don't have a correlated market, it means something is wrong. As traders you need to be aware of this and proceed with your eyes wide open.

At this hour all of Asia is trading Lower.  At this time all of Europe is trading Lower as well.

Possible Challenges To Traders Today

  • Crude Oil Inventories is out at 10:30 AM EST.  This is major.

  • Lack of Major Economic News.

Treasuries

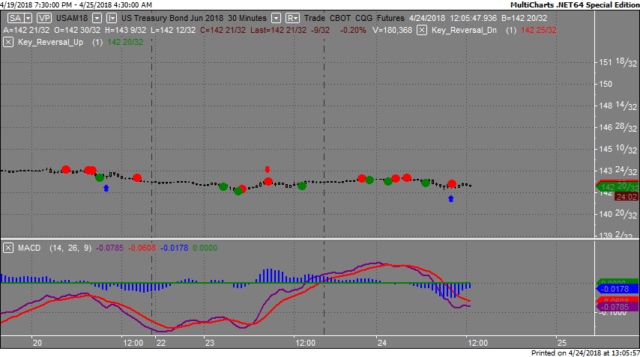
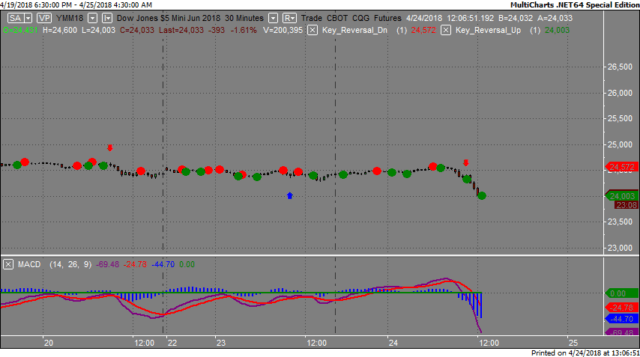
We've elected to switch gears a bit and show correlation between the 30 year bond (ZB) and The YM futures contract.  The YM contract is the DJIA and the purpose is to show reverse correlation between the two instruments.  Remember it's liken to a seesaw, when up goes up the other should go down and vice versa.

Yesterday the ZB made it's move at around 10 AM EST.  The ZB hit a Low at around that time and the YM hit a High.  If you look at the charts below ZB gave a signal at around 10 AM EST and the YM was moving Lower at the same time. Look at the charts below and you'll see a pattern for both assets. ZB hit a Low at around 10 AM and the YM was trending Lower at the same time.  These charts represent the newest version of MultiCharts and I've changed the timeframe to a 30 minute chart to display better.  This represented a long opportunity on the 30 year bond, as a trader you could have netted about a dozen ticks per contract on this trade.  Each tick is worth $31.25.

Charts Courtesy of MultiCharts built on an AMP platform

ZB

YM

Bias

Yesterday we gave the markets a Neutral bias as every instrument we track was pointed higher Tuesday morning.  Whenever you have a situation where everything is pointed either completely Higher or Lower, you don't have a correlated market, hence the neutral bias.  The Dow dropped 425 points and the other indices lost ground as well.  Today we aren't dealing with a correlated market and will maintain a neutral bias.

Could this change? Of Course.  Remember anything can happen in a volatile market. 

Commentary

Yesterday the economic news reported was (for the most part) positive yet the markets didn't react positively to this at all.  This can only prove the theory we brought forth yesterday and that is: markets fall on good economic news because the financial sector is concerned that the Federal Reserve will hike interest rates.  When I say hike interest rates let's be clear as to what the Fed will or won't do.  The Fed doesn't raise interest rates per se.  They raise the Overnight or Federal Funds Rate which is the rate the Fed charges banks to borrow money.  The banks in turn raise interest rates on their end to ensure a profit.  The financial sector doesn't borrow from a retail bank, they borrow from the Federal Reserve so the FFR (Federal Funds Rate) is very important to them as it will effect their profits in the long run.  The Fed on their end has already baked in 3 additional hikes this year which means the cost to borrow money is increasing.

Trading performance displayed herein is hypothetical. The following Commodity Futures Trading Commission (CFTC) disclaimer should be noted.

Hypothetical performance results have many inherent limitations, some of which are described below. No representation is being made that any account will or is likely to achieve profits or losses similar to those shown.

In fact, there are frequently sharp differences between hypothetical performance results and the actual results subsequently achieved by any particular trading program. One of the limitations of hypothetical performance trading results is that they are generally prepared with the benefit of hindsight.

In addition, hypothetical trading does not involve financial risk, and no hypothetical trading record can completely account for the impact of financial risk in actual trading. For example, the ability to withstand losses or to adhere to a particular trading program in spite of trading losses are material points which can also adversely affect actual trading results.

There are numerous other factors related to the markets in general or to the implementation of any specific trading program which cannot be fully accounted for in the preparation of hypothetical performance results and all of which can adversely affect actual trading results.

Trading in the commodities markets involves substantial risk and YOU CAN LOSE A LOT OF MONEY, and thus is not appropriate for everyone. You should carefully consider your financial condition before trading in these markets, and only risk capital should be used.

In addition, these markets are often liquid, making it difficult to execute orders at desired prices. Also, during periods of extreme volatility, trading in these markets may be halted due to so-called “circuit breakers” put in place by the CME to alleviate such volatility. In the event of a trading halt, it may be difficult or impossible to exit a losing position.

Recommended Content


Recommended Content

Editors’ Picks

EUR/USD hovers around 1.0700, eyes on US first-quarter GDP data

EUR/USD hovers around 1.0700, eyes on US first-quarter GDP data

EUR/USD hovers around the 1.0700 psychological level on Thursday during the early Thursday. The modest uptick of the major pair is supported by the softer US Dollar. Later in the day, Germany’s GfK Consumer Confidence Survey for April will be released. 

EUR/USD News

USD/JPY finds its highest bids since 1990, near 155.50

USD/JPY finds its highest bids since 1990, near 155.50

USD/JPY keeps breaking into its highest chart territory since June of 1990 early Thursday, testing 155.50 for the first time in 34 years as the Japanese Yen remains vulnerable, despite looming Japanese intervention risks. Focus shifts to Thursday's US GDP report and the BoJ decision on Friday. 

USD/JPY News

Gold price lacks firm intraday direction, holds steady above $2,300 ahead of US data

Gold price lacks firm intraday direction, holds steady above $2,300 ahead of US data

Gold price remains confined in a narrow band for the second straight day on Thursday. Reduced Fed rate cut bets and a positive risk tone cap the upside for the commodity. Traders now await key US macro data before positioning for the near-term trajectory.

Gold News

Injective price weakness persists despite over 5.9 million INJ tokens burned

Injective price weakness persists despite over 5.9 million INJ tokens burned

Injective price is trading with a bearish bias, stuck in the lower section of the market range. The bearish outlook abounds despite the network's deflationary efforts to pump the price. Coupled with broader market gloom, INJ token’s doomed days may not be over yet.

Read more

Meta Platforms Earnings: META sinks 10% on lower Q2 revenue guidance Premium

Meta Platforms Earnings: META sinks 10% on lower Q2 revenue guidance

This must be "opposites" week. While Doppelganger Tesla rode horrible misses on Tuesday to a double-digit rally, Meta Platforms produced impressive beats above Wall Street consensus after the close on Wednesday, only to watch the share price collapse by nearly 10%.

Read more

Majors

Cryptocurrencies

Signatures