Markets Rise Despite Lukewarm Eco News

Good Morning Traders,
As of this writing 4:10 AM EST, here’s what we see:
US Dollar: Sept. USD is Down at 94.875.
Energies: Sept '18 Crude is Up at 69.22.
Financials: The Sept 30 year bond is Down 2 ticks and trading at 142.17.
Indices: The Sept S&P 500 emini ES contract is 2 ticks Lower and trading at 2859.25.
Gold: The Aug gold contract is trading Up at 1222.30 Gold is 40 ticks Higher than its close.
Initial Conclusion
This is not a correlated market. The dollar is Down- and Crude is Up+ which is normal and the 30 year Bond is trading Lower. The Financials should always correlate with the US dollar such that if the dollar is lower then bonds should follow and vice-versa. The S&P is Lower and Crude is trading Higher which is correlated. Gold is trading Up+ which is correlated with the US dollar trading Lower. I tend to believe that Gold has an inverse relationship with the US Dollar as when the US Dollar is down, Gold tends to rise in value and vice-versa. Think of it as a seesaw, when one is up the other should be down. I point this out to you to make you aware that when we don't have a correlated market, it means something is wrong. As traders you need to be aware of this and proceed with your eyes wide open.
At this hour all of Asia is trading Mixed with half the exchanges Higher and the other half Lower. At this time Europe is trading mainly Higher with the exception the German Dax which is fractionally Lower at this time..
Possible Challenges To Traders Today
-
FOMC Member Barkin Speaks at 8:45 AM EST. This is major.
-
Crude Oil Inventories are out at 10:30 AM EST. This is major.
-
10-y Bond Auction starts at 1 PM EST. This is major.
Treasuries
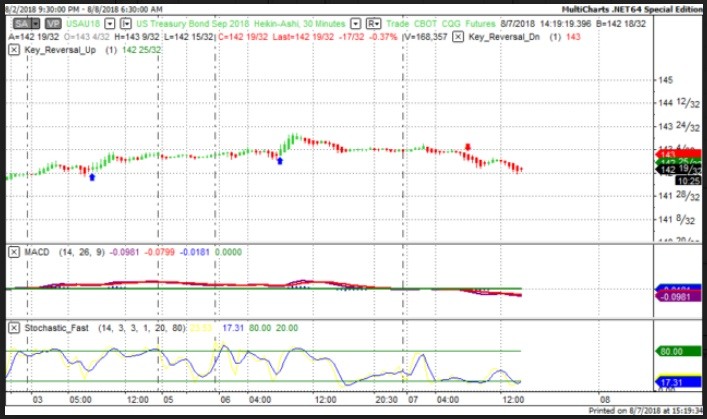
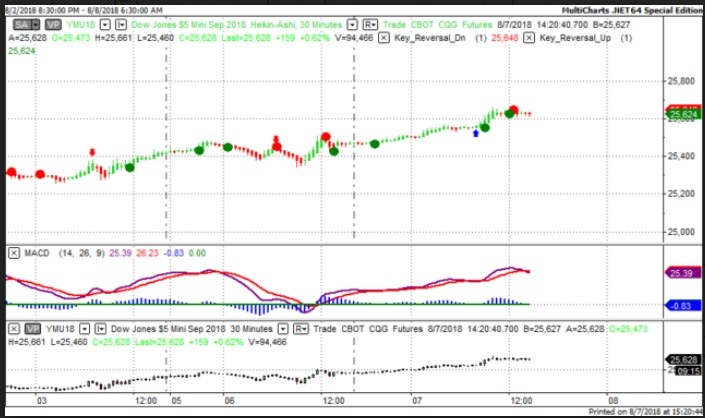
We've elected to switch gears a bit and show correlation between the 30 year bond (ZB) and The YM futures contract. The YM contract is the DJIA and the purpose is to show reverse correlation between the two instruments. Remember it's liken to a seesaw, when up goes up the other should go down and vice versa.
Yesterday the ZB made it's move at around 8 AM EST. The ZB hit a High at around that time and the YM hit a Low. If you look at the charts below ZB gave a signal at around 8 AM EST and the YM was moving Higher at the same time. Look at the charts below and you'll see a pattern for both assets. ZB hit a High at around 8 AM and the YM was moving Higher at the same time. These charts represent the newest version of MultiCharts and I've changed the timeframe to a 30 minute chart to display better. This represented a shorting opportunity on the 30 year bond, as a trader you could have netted about 15 ticks per contract on this trade. Each tick is worth $31.25.
Charts Courtesy of MultiCharts built on an AMP platform.
Bias
Yesterday we gave the markets an Upside bias as the USD and the Bonds were both trading Lower yesterday morning and this usually bodes well for an Upside day. The markets didn't disappoint as the Dow rose 127 points and the other indices gained ground as well. Today we aren't dealing with a correlated market and our bias is Neutral.
Could this change? Of Course. Remember anything can happen in a volatile market.
Commentary
So yesterday the markets rose despite not too stellar economic news as the Jolts Job Openings came in at 6.66 million versus 6.74 million expected. Now one may wonder "how is it possible that the markets rise when job openings didn't meet expectation"? The mindset is the Fed won't be too eager to raise rates next month when they meet with more negative news to dwell on. Whether this actually occurs or not is pure speculation but there is an old saying that says perception becomes reality. Again, whether that occurs only time will tell.
Author

Nick Mastrandrea
Market Tea Leaves


