Market update: Bearish british pound setup

GBP/USD 4 hour
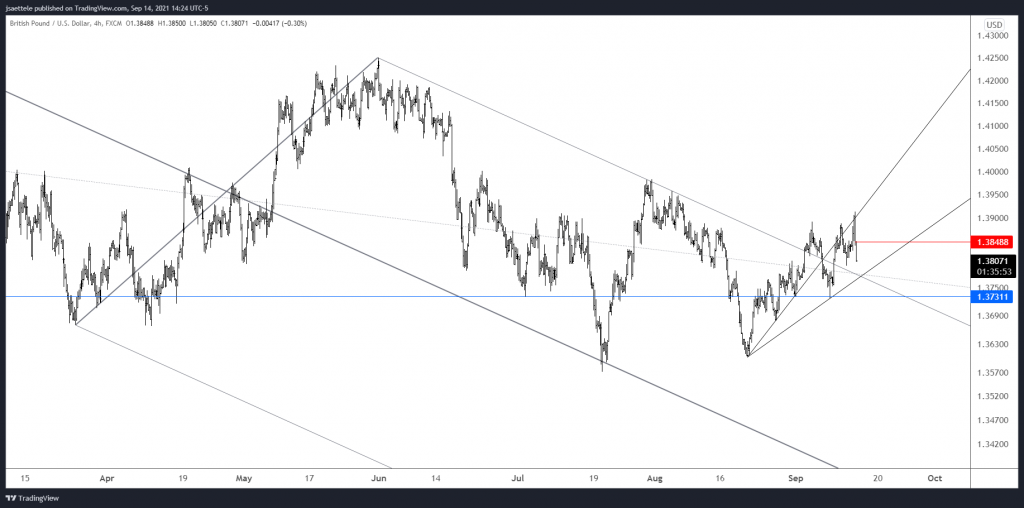
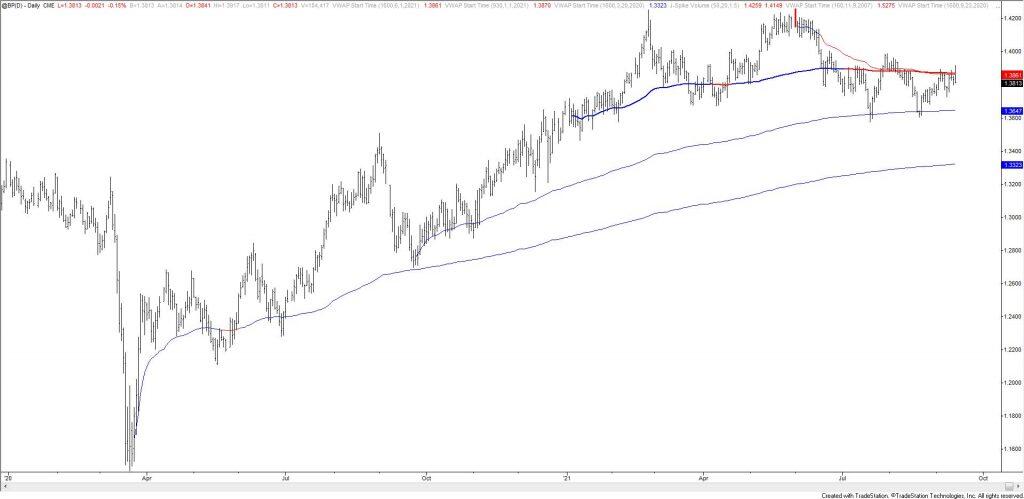
Cable put in a BIG reversal today. I’m not sure what’s going on from a pattern perspective but today’s reversal was accompanied by high volume. The chart below shows high volume (1 day) reversals in futures. Those are some good signals! Also, note that 2021 VWAP was resistance (2 charts down). ‘Levels wise’, price might bounce from near 1.3775. Watch for resistance near 1.3445.
British pound futures daily
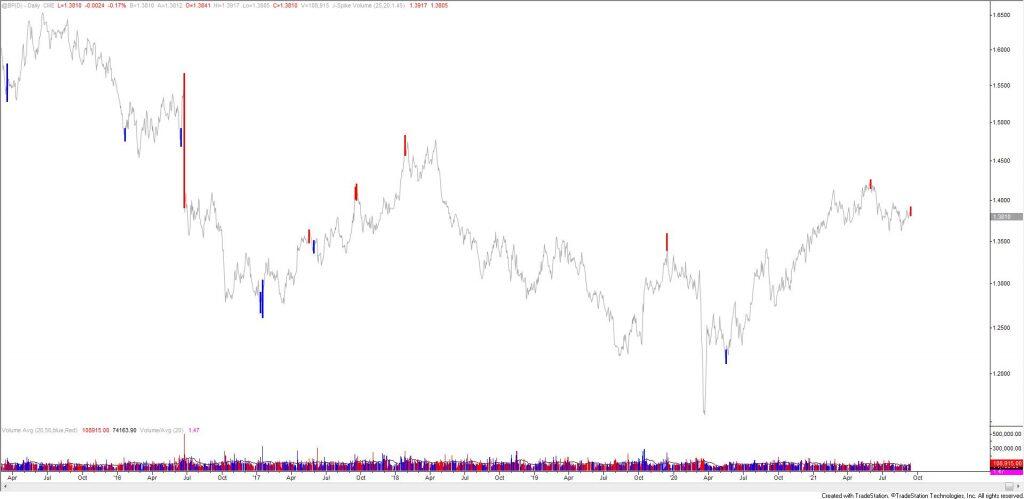
British pound futures daily
NZD/USD daily
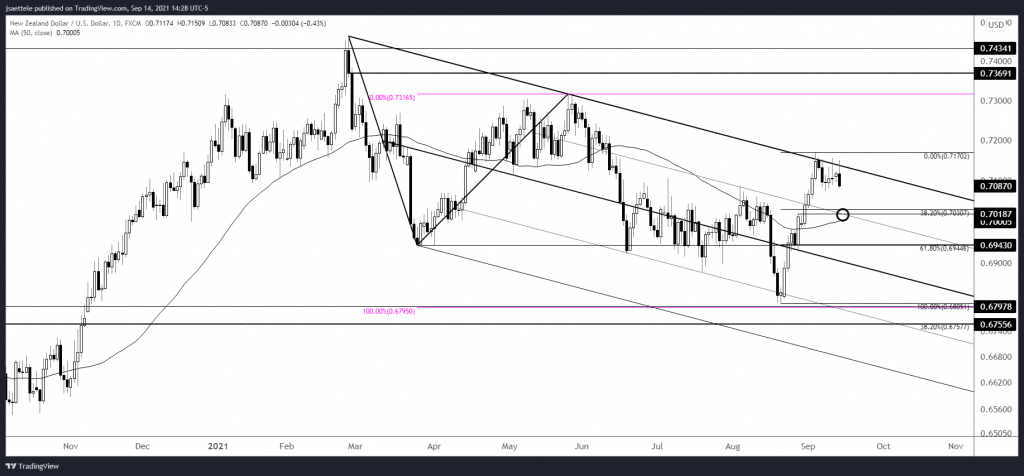
NZDUSD is finally trying to separate from resistance (upper parallel of the 2021 channel). Downside focus, at least in the near term, remains .7020/30. The 50 day average is creeping up on this level now as well.
9/8 – The Kiwi drop also appears impulsive (5 waves). The implication is the same as it is for GBPUSD. That is, I’m thinking that a corrective (3 wave) bounce is underway from today’s low 7127/36 is ideal resistance. Near term downside focus remains 7030 or so.
USD/CAD 4 hour
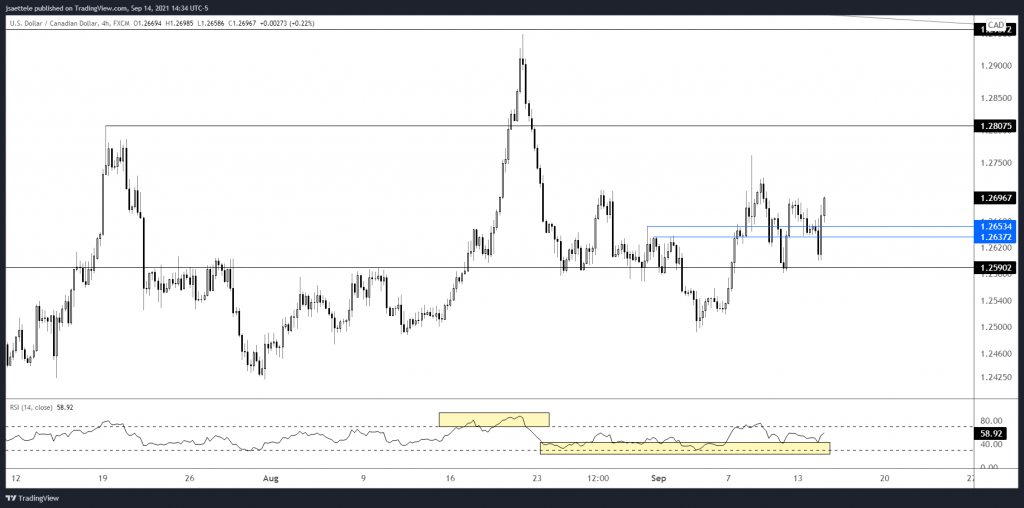
USDCAD dipped under 1.2625 before turning sharply higher today. Action since late August has the look of an inverse head and shoulders pattern as well. The neckline is 1.2710/30. If price pulls back within the range then watch for 1.2640/50 for support. I’d love a spike on CPI in order to buy into support with a tight stop on Wednesday. I’ve highlighted the bullish RSI profile as well.
9/13 – We’ve been nailing USDCAD levels! USDCAD responded in kind to the noted 1.2580/90 proposed support and the sequence of waves since 9/3 (impulsive upside and corrective downside) favors the upside. As such, watch for support near 1.2625 (61.8%). The next upside level is unclear although bullish risk is tight at just under 1.2582.
GBP/JPY 4 hour
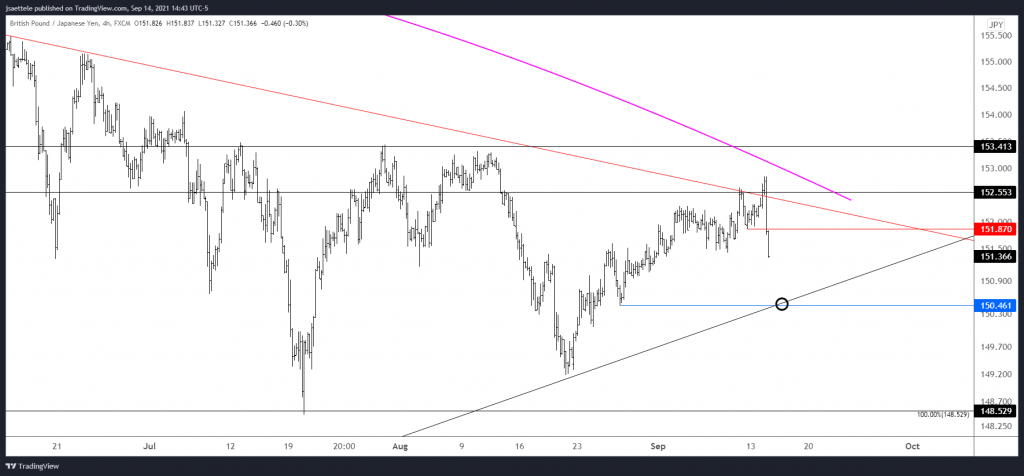
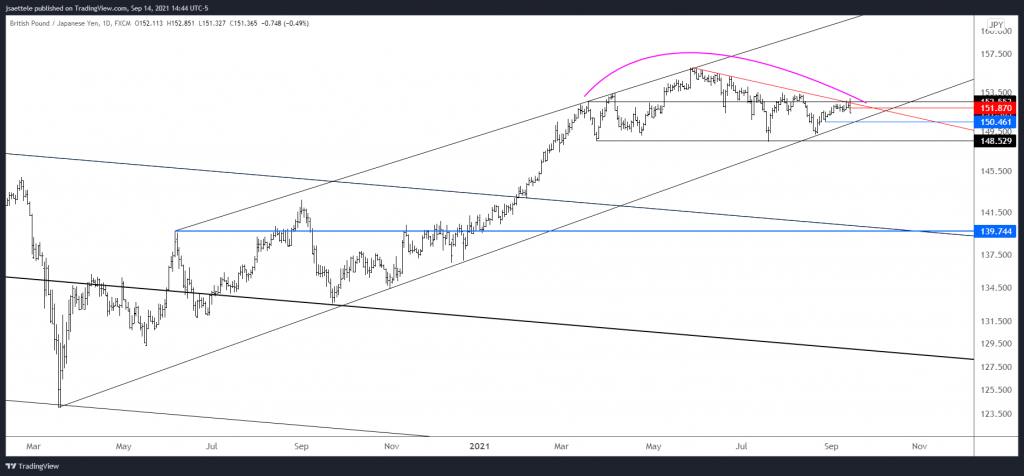
GBPJPY has rolled over from 3+ month trendline resistance. There is the specter of a 6 month head and shoulders with a 148.50 neckline. If confirmed, the target for the h&s would be just under 140 (see zoomed out view below). Action since the March 2020 low is also a textbook wedge. Wedges often result in sharp reversals and this wedge would break below 150.50. Proposed near term resistance is 151.90-152.10. Bottom line, the potential is there for GBPJPY short to be a massive trade.
GBP/JPY daily
EUR/GBP daily
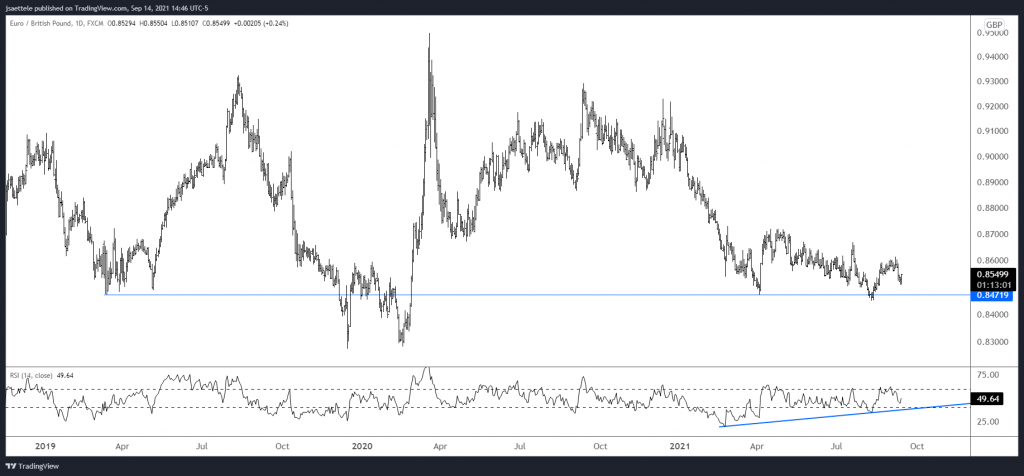
EURGBP looks constructive. A possible double bottom is visible at a well-defined long term horizontal level. I looked at this cross after seeing the big GBPUSD reversal and GBPJPY short setup. The view here is ‘in line’ with a period of GBP underperformance.
Author

Scandinavian Markets Research Team
Scandinavian Capital Markets
Scandinavian Capital Markets' Research Team boasts world-renowned, professional market analysts and traders with proven track records in the markets and as business leaders.


