Market mutes ahead of FOMC statement
Awaiting the FOMC interest rate decision, the dollar index halts, reflecting market expectations of another rate hike later this year, while today's announcement may bring a temporary pause.
In the lead-up to today's eagerly awaited FOMC interest rate decision, market volatility has remained relatively subdued. The dollar index maintains its position above the $105 mark, reflecting market expectations of another rate hike later this year, while today's announcement may bring a temporary pause. Notably, bond yields in Australia and New Zealand have surged to levels unseen since 2007. These rising bond yields may bolster the strength of their respective currencies. Additionally, China's decision to keep its benchmark lending rates unchanged had a notable impact, causing robust oil prices to decline, with WTI crude oil experiencing a 1.65% drop yesterday.
Market movements
Dollar index
The US dollar traded flat ahead of the FOMC meeting. The 2-year and 10-year Treasury yields reaching their highest levels since 2006 and 2007 indicate a significant shift in the interest rate environment. Investors are closely monitoring these yields as they can signal the market's expectations regarding future Federal Reserve actions. The Fed's potential hawkish stance in response to inflationary concerns is driving these yield movements.
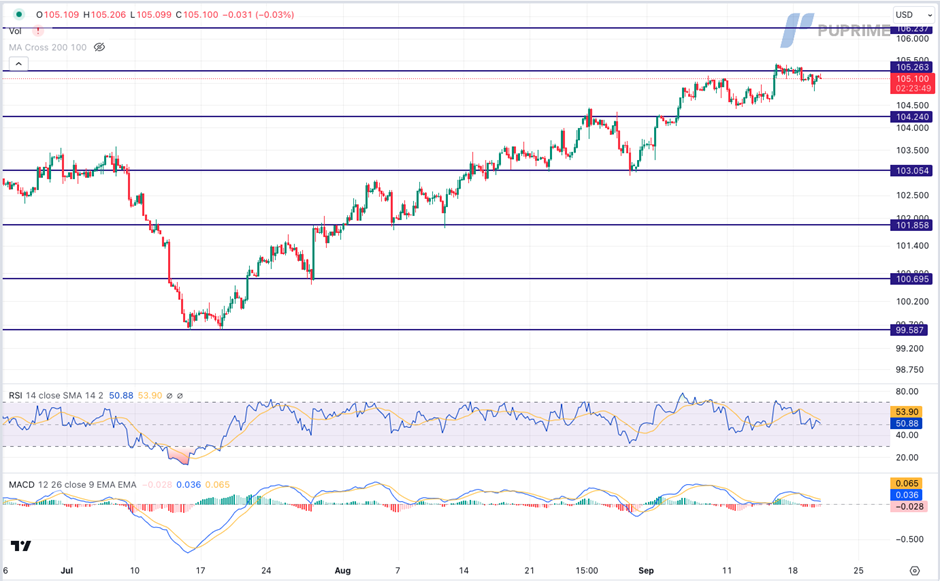
The Dollar Index is trading flat while currently hovering nearby the resistance level. However, MACD has illustrated diminishing bearish momentum, while RSI is at 51, suggesting the index might consolidate within a range since the RSI near the midline.
Resistance level: 105.25, 106.25.
Support level: 104.25, 103.05.
XAU/USD
Gold prices remaining flat ahead of the FOMC meeting reflect the uncertainty surrounding the Fed's monetary decisions. Gold traditionally serves as a safe-haven asset during times of economic and financial uncertainty. Investors should be prepared for potential volatility in gold prices depending on the Fed's actions.
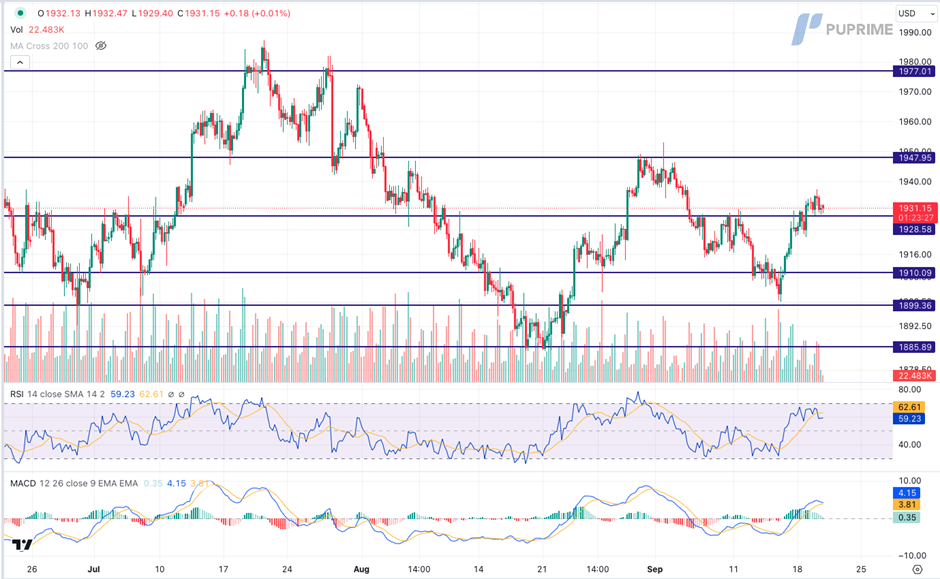
Gold prices are trading flat while currently testing the support level. However, MACD has illustrated diminishing bullish momentum, while RSI is at 59, suggesting the commodity might experience technical correction since the RSI retreated sharply from overbought territory.
Resistance level: 1950.00, 1975.00.
Support level: 1930.00, 1910.00.
EUR/USD
The euro exhibited a sideways trend and faced resistance near the 1.0700 level, with investors eagerly awaiting the release of the FOMC statement today. Eurozone CPI figures showed a minor decrease, slipping from the previous 5.3% to the current 5.2%, signalling a potential slowdown in inflation within the economic bloc and subsequently dampening the euro's strength. While the market widely anticipates the Fed to pause its rate hikes in September, analysts are betting that the Fed might deliver at least one more rate hike in 2023. This sentiment has provided support for the dollar.
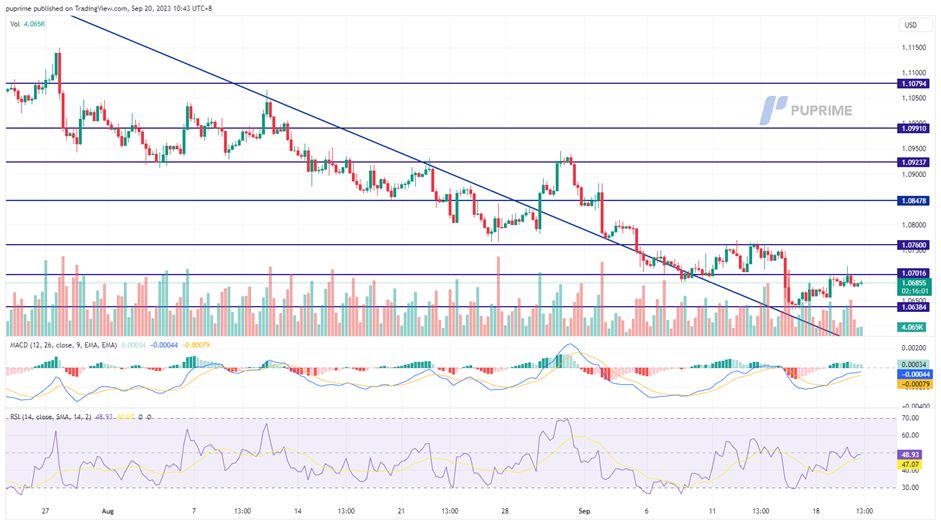
EUR/USD is trading above its long-term downtrend resistance level; a break above the 1.0700 level will be a solid bullish signal for the pair. The MAACD has crossed and is moving toward the zero line from below while the RSI has rebounded from the bottom, suggesting a trend reversal for the pair as well.
Resistance level: 1.0700, 1.0760.
Support level: 1.0640, 1.0540.
GBP/USD
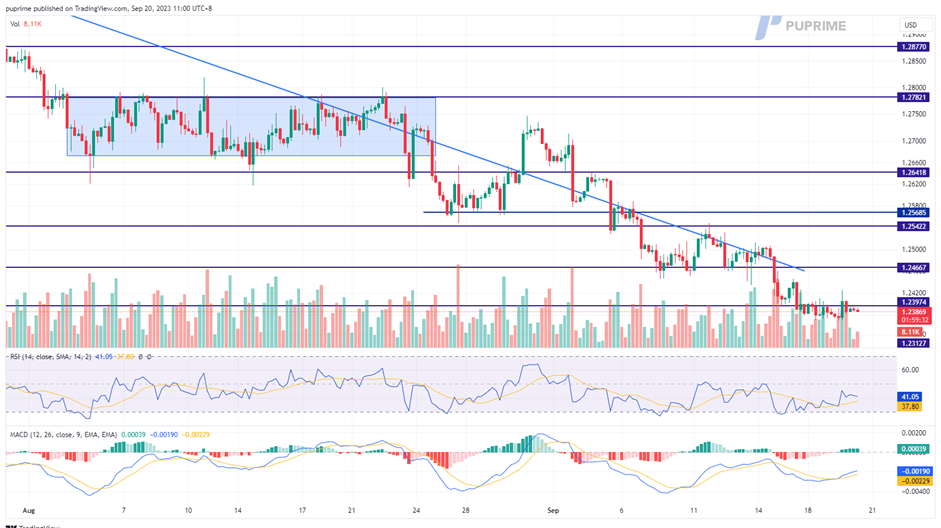
The British Pound, Sterling, has remained in a sideways trading pattern, hovering at lowest levels not seen since early June. While the market expects the Fed to pause its rate hikes, with a decision scheduled for today, there's anticipation of at least one more round of rate hikes by the end of 2023, which is boosting the strength of the US dollar. Additionally, investors are watching the UK's Consumer Price Index (CPI) set to be released today. This data will likely play a role in speculating on the Bank of England's interest rate decision, expected tomorrow, and will influence the direction of the Sterling.
Pound Sterling remains under the long-term downtrend resistance level while both RSI and MACD hover at the lower region, suggesting the bearish momentum is still intact with the Cable.
Resistance level: 1.2460, 1.2550.
Support level: 1.2310, 1.2200.
NZD/USD
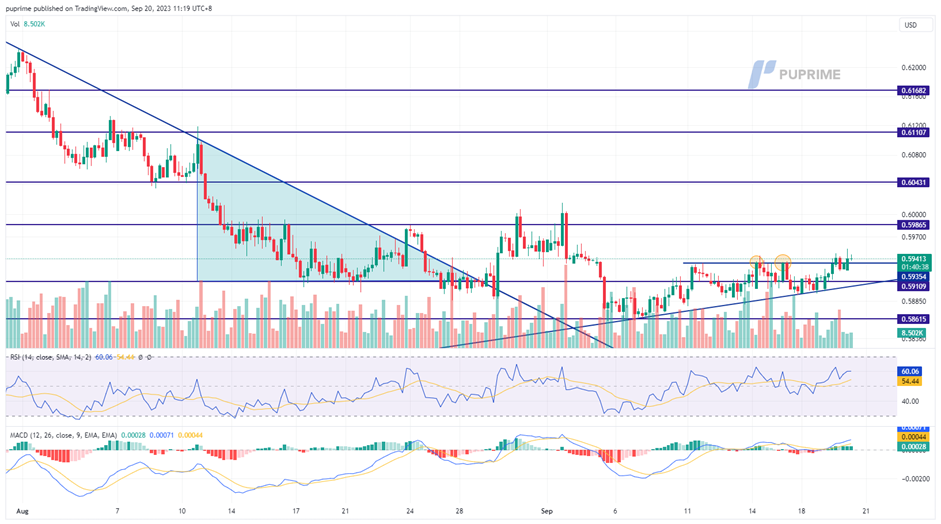
The New Zealand dollar has exhibited resilience despite a strong US dollar as it strives to breach its short-term resistance level at 0.5935. China's policy decisions have somewhat restrained the Kiwi's strength, particularly the People's Bank of China (PBoC) keeping its benchmark lending rate unchanged. However, an exciting development is the surge in New Zealand's short-term bond yields, reaching levels not seen in decades. This rise could potentially lead to an appreciation of the currency. Additionally, investors will be closely watching the release of New Zealand's GDP data tomorrow, which will serve as a gauge of the Kiwi's overall strength.
The Kiwi is breaking its short-term resistance level, exhibiting a bullish signal for the Kiwi. The RSI is gaining to the overbought zone while the MACD continues to climb, suggesting the bullish momentum is gaining.
Resistance level: 0.5980, 0.6050.
Support level: 0.5910, 0.5860.
Dow jones
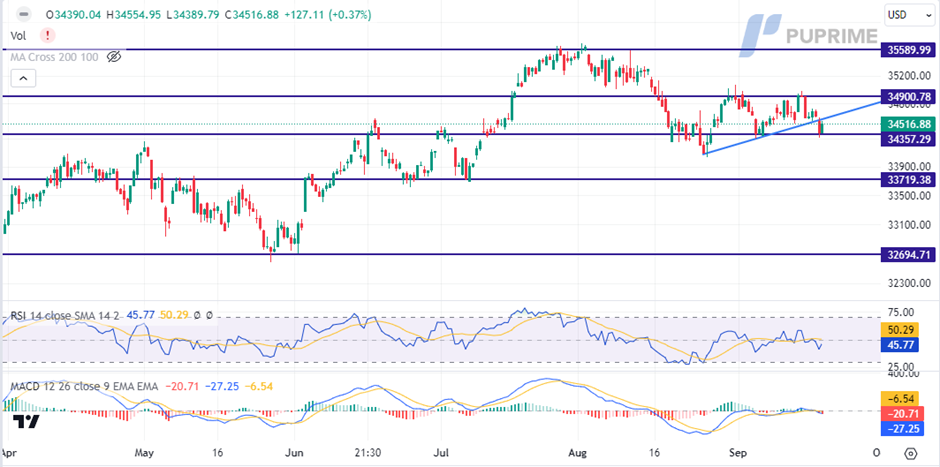
Rising US Treasury yields have put pressure on US equity markets. Investors are apprehensive about the potential impact of the Federal Reserve's decisions on equity markets. As a result, there has been a shift towards safer assets and a move away from riskier equities in the lead-up to the FOMC meeting.
The Dow is trading lower while currently testing the support level. MACD has illustrated increasing bearish momentum, while RSI is at 46, suggesting the index might extend its losses after breakout since the RSI stays below the midline.
Resistance level: 34900.00, 35590.00.
Support level: 34355.00, 33720.00.
USD/JPY
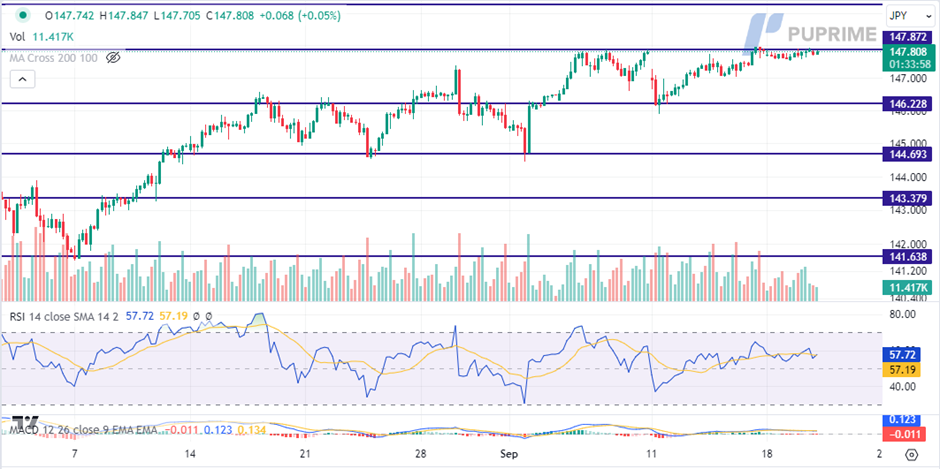
The USD/JPY pair is highly sensitive to yield differentials between US and Japanese Treasury bonds. The upcoming FOMC meeting is expected to cause significant yield movements, which could have a substantial impact on USD/JPY. The Bank of Japan's stance on keeping interest rates ultra-low contrasts with other central banks, making this currency pair particularly intriguing for investors.
USD/JPY is trading higher while currently testing the resistance level. MACD has illustrated increasing bullish momentum, while RSI is at 58, suggesting the pair might extend its gains after it successfully breakout above the resistance level.
Resistance level: 147.85, 149.30.
Support level: 146.25, 144.70.
CL Oil
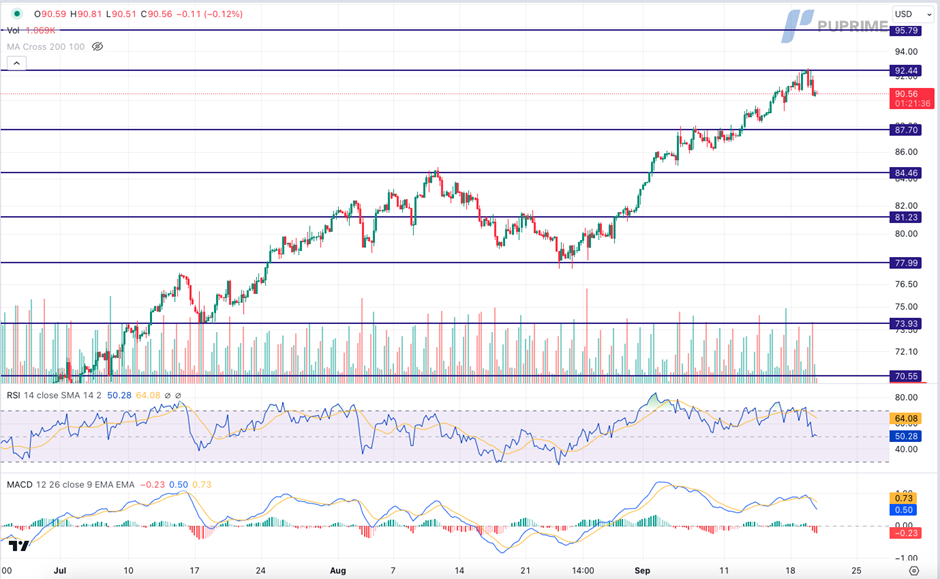
While oil prices retreated due to technical corrections and profit-taking, the fundamental outlook for oil remains positive. Expectations of supply cuts from key producers like Russia and Saudi Arabia continue to support oil prices. However, the market's focus is also on the recovery of the Chinese economy, which can influence future oil price movements.
Oil prices are trading lower following the prior retracement from the resistance level. MACD has illustrated increasing bearish momentum, while RSI is at 50, suggesting the commodity might extend its losses since the RSI retreated sharply from overbought territory.
Resistance level: 92.45, 95.80.
Support level: 87.70, 84.45.
Author

PU Prime team
PU Prime
PU Prime is an award-winning CFD broker offering clients access to multiple products across multiple asset classes. Traders will have access to FX, Commodities, Indices, Share CFDs and Bonds.


