Market moves: Riding the wave with CAD/JPY's breakout and USD/CAD's tug-of-war

In this comprehensive analysis, we delve into the intricate dynamics shaping the USD/CAD and CAD/JPY currency pairs, offering advanced traders a deep dive into their current technical postures amidst fluctuating market conditions. For USD/CAD, the pair remains ensnared in a tug-of-war around the 200-day moving average, with bulls struggling to cement gains above this critical resistance, while robust support levels have thwarted sellers' attempts at a reversal, rendering the market range-bound.
Conversely, CAD/JPY presents a more directional narrative, hovering near a 16-year peak with bullish forces at play, yet facing challenges in sustaining a breakout. This juxtaposition of a stagnant USD/CAD against the potentially ascendant CAD/JPY highlights a diverse forex landscape, where strategic acumen is key to navigating the nuances of resistance and support levels, the significance of psychological barriers, and the overarching influence of fundamental factors that could precipitate shifts in trader sentiment and market direction.
USD/CAD analysis
The USD/CAD pair has been engaging in a challenging confrontation with the 200-day moving average over the last four weeks, indicating a strong resistance point that the bulls have failed to decisively breach. The most recent attempt to surpass this level culminated in a doji candlestick formation at 1.3538, signifying indecision and a potential turning point following a failed resistance test.
Despite the evident pressure from sellers, their attempts to initiate a reversal have been stymied by robust support within the 1.3338 to 1.3387 range. This support zone, which was firmly established earlier in the year, has effectively maintained the pair's lows above it. The defense of this zone can be attributed to deeper structural supports, including a bullish trendline that connects swing lows from 2021 and 2022, which was instrumental in the rally towards the 200-day moving average late in 2023. Furthermore, the 1.3200 level emerges as a critical support that has proven resilient against bearish attempts, particularly noted during the extended bearish pressure last summer.
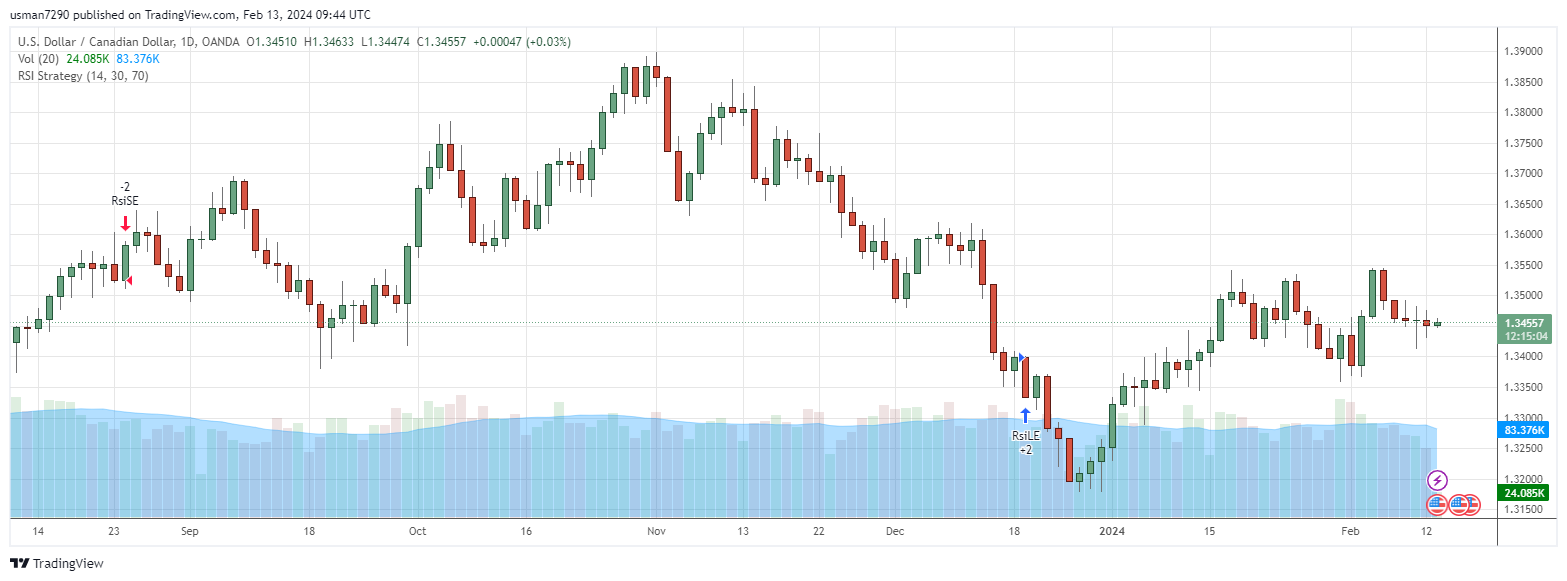
The resistance framework is well-defined by the 200-day moving average coupled with the psychological barrier around 1.3500. Despite bullish attempts to advance, the resistance at 1.3538 has recurrently capped the highs, indicating a significant level of interest.
The current market scenario for USD/CAD is predominantly range-bound, with the price oscillating near the midpoint of the established range, suggesting a wait-and-see approach may be prudent until a clear directional bias emerges.
CAD/JPY analysis
CAD/JPY offers a more directional perspective, currently positioned near the zenith of a fresh 16-year high set last week. However, the bullish momentum required for a sustained breakout has been elusive, reflecting a similar pattern observed over the past few months.
A historical analysis reveals a failed attempt to breach a new high last September, followed by a pullback. This was succeeded by a lower-high formation and a subsequent retracement until the 200-DMA provided support, setting the stage for a bullish resurgence that swiftly reclaimed resistance levels, culminating in the establishment of a new 16-year high last week.
The resilience demonstrated by bulls, especially in returning to challenge the resistance threshold, suggests a bullish dominance in the CAD/JPY pair. However, the proximity to resistance warrants a cautious approach, with potential for reversal scenarios to be explored, particularly if fundamental factors prompt a reassessment of the bullish stance.
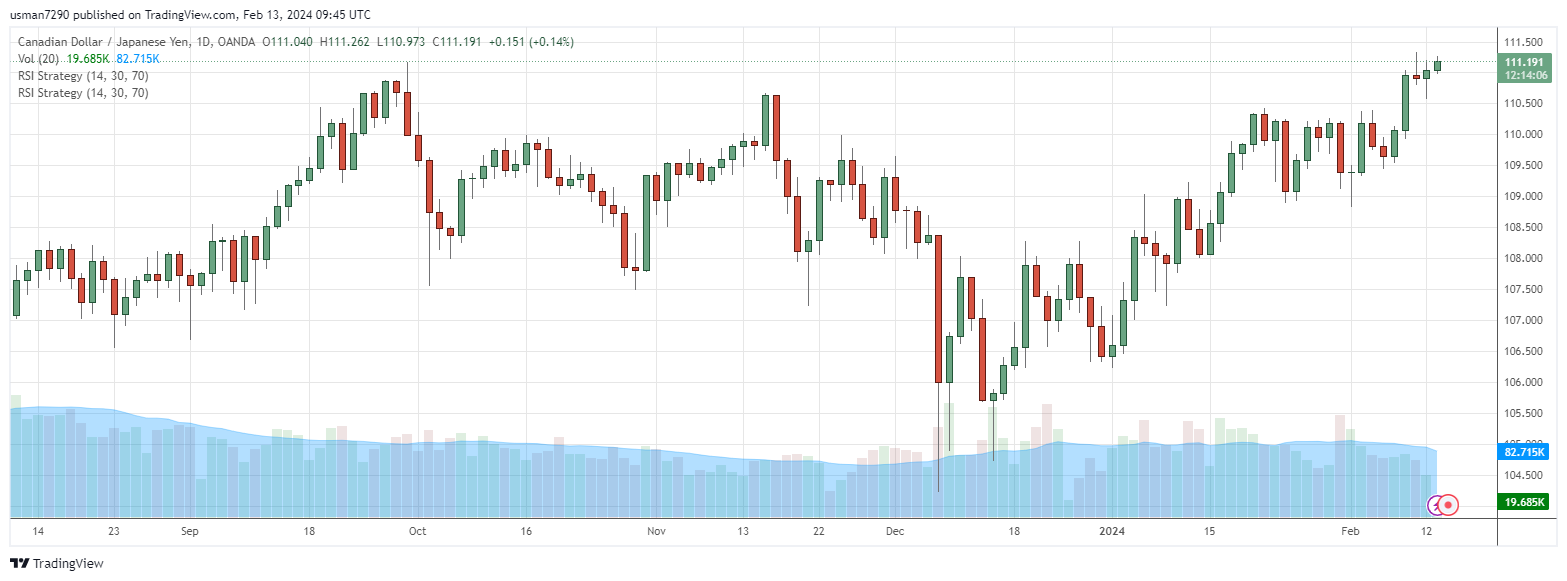
The carry trade dynamic, similar to the USD/JPY pair, supports the bullish thesis for CAD/JPY, although concerns regarding intervention by the Japanese Finance Ministry near the 150.00 level (a significant psychological barrier) could introduce volatility and potential reversal triggers for JPY pairs.
On the technical front, the daily chart indicates sustained bullish attempts with the current price action testing resistance levels. The establishment of a new 16-year high at 111.33 is pivotal, with the market now eyeing the sustainability of this breakout. A failure to maintain upward momentum beyond this point could activate a reversal scenario, necessitating vigilance for bearish signals below 111.17, which could expose the next support at 110.62.
In summary, while the bullish sentiment prevails in CAD/JPY, traders should remain alert to reversal indicators, especially in light of potential fundamental shifts affecting the pair. The strategic positioning would involve monitoring for a definitive breakout or reversal signals, with a keen eye on underlying market dynamics and geopolitical factors that could influence currency movements.
Author

Usman Ahmed
Forex92
Usman Ahmed is a currency trader and financial market analyst with more than a decade of active trading experience.


