APHRIA is a Canadian cannabis company (TSX:APHA) and in November 2018 it was listed in New York Stock Exchange. The company is as a leader in the production of pharmaceutical-grade cannabis and also produces a range of marijuana and cannabis oil products.

In 2018, Aphria stock took a big hit with a 75% decline as world stock market struggled during the whole year with majority of stocks correcting multi-year cycles. However, with every correction it comes a new investing opportunity and APHA has a clear technical structure providing a clear path.

APHA decline from 2018 peak is in 3 waves ( abc ) which represent an Elliott Wave corrective structure called Zigzag. The measured target for wave c is at 100% – 123.6% Fibonacci extension area $4 – $0.96 which the stock already reached. Therefore, a final leg lower may or may not happen at this stage to end the entire correction before the stock either  start a new bullish cycle or bounce in 3 waves at least.

Aphria APHA Weekly Chart

APHA

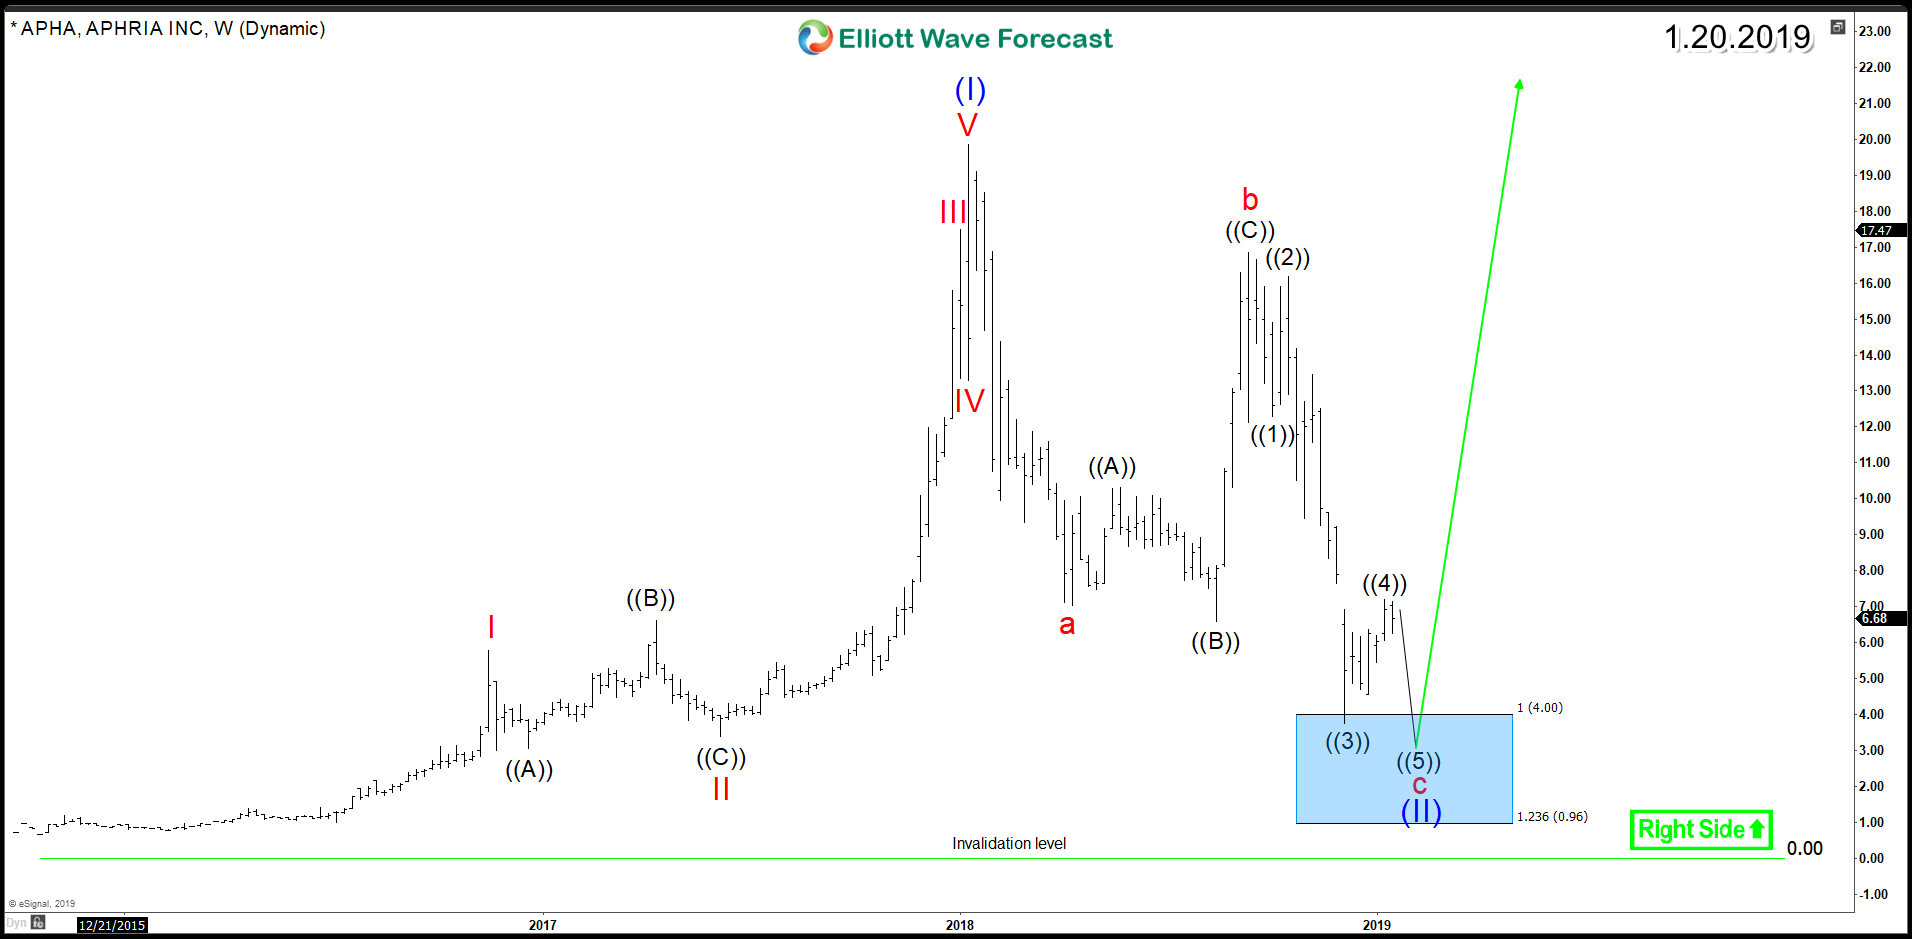
The blue boxes in the above chart is a High-frequency area where Market are likely to end cycles and make a turn. Consequently, it can be used to take position in favor of the main trend which is in the case of Aphria to the upside as the previous cycle was an impulsive 5 waves advance. 2019 can be a good year for Marijuana stocks at least for a recovery against 2018 decline.


Become a Successful Trader and Master Elliott Wave like a Pro. Start your Free 14 Day Trial at - Elliott Wave Forecast.

FURTHER DISCLOSURES AND DISCLAIMER CONCERNING RISK, RESPONSIBILITY AND LIABILITY Trading in the Foreign Exchange market is a challenging opportunity where above average returns are available for educated and experienced investors who are willing to take above average risk. However, before deciding to participate in Foreign Exchange (FX) trading, you should carefully consider your investment objectives, level of xperience and risk appetite. Do not invest or trade capital you cannot afford to lose. EME PROCESSING AND CONSULTING, LLC, THEIR REPRESENTATIVES, AND ANYONE WORKING FOR OR WITHIN WWW.ELLIOTTWAVE- FORECAST.COM is not responsible for any loss from any form of distributed advice, signal, analysis, or content. Again, we fully DISCLOSE to the Subscriber base that the Service as a whole, the individual Parties, Representatives, or owners shall not be liable to any and all Subscribers for any losses or damages as a result of any action taken by the Subscriber from any trade idea or signal posted on the website(s) distributed through any form of social-media, email, the website, and/or any other electronic, written, verbal, or future form of communication . All analysis, trading signals, trading recommendations, all charts, communicated interpretations of the wave counts, and all content from any media form produced by www.Elliottwave-forecast.com and/or the Representatives are solely the opinions and best efforts of the respective author(s). In general Forex instruments are highly leveraged, and traders can lose some or all of their initial margin funds. All content provided by www.Elliottwave-forecast.com is expressed in good faith and is intended to help Subscribers succeed in the marketplace, but it is never guaranteed. There is no “holy grail” to trading or forecasting the market and we are wrong sometimes like everyone else. Please understand and accept the risk involved when making any trading and/or investment decision. UNDERSTAND that all the content we provide is protected through copyright of EME PROCESSING AND CONSULTING, LLC. It is illegal to disseminate in any form of communication any part or all of our proprietary information without specific authorization. UNDERSTAND that you also agree to not allow persons that are not PAID SUBSCRIBERS to view any of the content not released publicly. IF YOU ARE FOUND TO BE IN VIOLATION OF THESE RESTRICTIONS you or your firm (as the Subscriber) will be charged fully with no discount for one year subscription to our Premium Plus Plan at $1,799.88 for EACH person or firm who received any of our content illegally through the respected intermediary’s (Subscriber in violation of terms) channel(s) of communication.

Recommended Content


Recommended Content

Editors’ Picks

EUR/USD retreats toward 1.0650 after PMI-inspired rebound

EUR/USD retreats toward 1.0650 after PMI-inspired rebound

EUR/USD loses traction and retreats to the 1.0650 area after rising toward 1.0700 with the immediate reaction to the upbeat PMI reports from the Eurozone and Germany. The cautious market stance helps the USD hold its ground ahead of US PMI data.

EUR/USD News

GBP/USD fluctuates near 1.2350 after UK PMIs

GBP/USD fluctuates near 1.2350 after UK PMIs

GBP/USD clings to small daily gains near 1.2350 in the European session on Tuesday. The data from the UK showed that the private sector continued to grow at an accelerating pace in April, helping Pound Sterling stay resilient against its rivals.

GBP/USD News

Gold flirts with $2,300 amid receding safe-haven demand

Gold flirts with $2,300 amid receding safe-haven demand

Gold (XAU/USD) remains under heavy selling pressure for the second straight day on Tuesday and languishes near its lowest level in over two weeks, around the $2,300 mark in the European session. Eyes on US PMI data. 

Gold News

Here’s why Ondo price hit new ATH amid bearish market outlook Premium

Here’s why Ondo price hit new ATH amid bearish market outlook

Ondo price shows no signs of slowing down after setting up an all-time high (ATH) at $1.05 on March 31. This development is likely to be followed by a correction and ATH but not necessarily in that order.

Read more

US S&P Global PMIs Preview: Economic expansion set to keep momentum in April

US S&P Global PMIs Preview: Economic expansion set to keep momentum in April

S&P Global Manufacturing PMI and Services PMI are both expected to come in at 52 in April’s flash estimate, highlighting an ongoing expansion in the private sector’s economic activity.

Read more

Majors

Cryptocurrencies

Signatures