Majors technical outlook: Nonfarm Payrolls looms

EUR/USD
Bolstered by rising US Treasury yields, the US dollar wrapped up another day in positive territory, extending Wednesday’s 1.4 per cent recovery (according to the US Dollar Index). Consequently, Europe’s shared currency concluded Thursday in negative territory against the buck, as well as the Japanese yen (safe-haven currencies embraced a healthy bid).
From a technical perspective, daily and weekly timeframes emphasise a clear-cut downtrend—those who follow Dow Theory will likely label this as a primary bear trend (long term). The weekly timeframe’s current candle also demonstrates a well-defined upper wick, signifying strong selling pressure and placing a bold question mark on weekly support from $0.9606—held firm last week as price rebounded from 20-year lows ($0.9536). Engulfing current support unearths a Quasimodo formation at $0.9241.
The daily timeframe’s price movement continues to work under its 200-day simple moving average ($1.0625) and in recent days rotated south of trendline resistance, extended from the high $1.1495, and neighbouring Quasimodo resistance from $1.0090. To the downside, Quasimodo resistance-turned support calls for attention at $0.9573, closely shadowed by support at $0.9377.
Shorter term, the currency pair is on the doorstep of $0.98 on the H1 chart, threatening a break towards a H1 Fibonacci cluster, made up of between $0.9762 and $0.9779 (100% projection is not a Fibonacci ratio). The technically interesting thing about this Fibonacci cluster, aside from the number of ratios it houses, is its location: south of a psychological level which implies a stop-run could unfold.
Technical expectation:
While the longer-term trend is decisively southbound, a whipsaw through $0.98 to test bid strength at the H1 Fibonacci cluster between $0.9762 and $0.9779 could be seen. How much of a bullish response the market sees from the aforementioned area of support is difficult to estimate for obvious (technical) reasons (trend), though a short-term reaction that reclaims $0.98 is not out of the question.
-638006850534483628.jpg)
AUD/USD
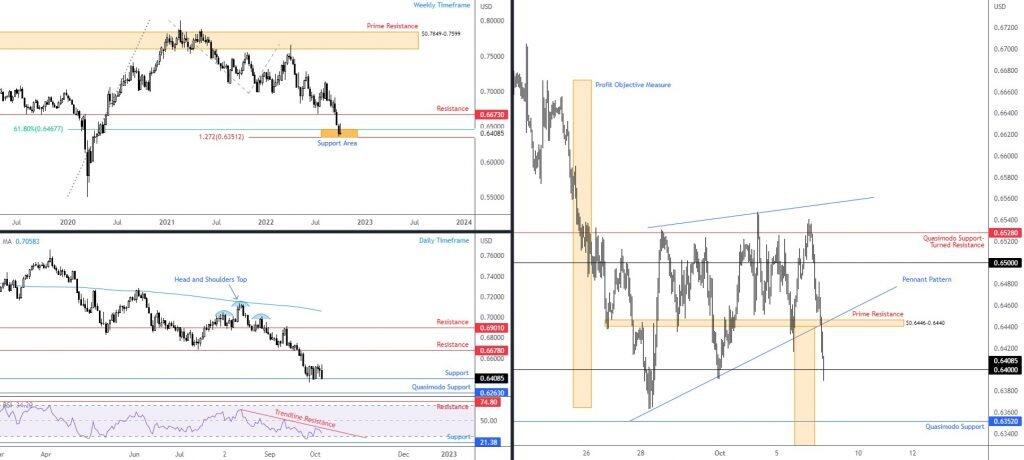
Against a broadly stronger US dollar, things turned sour for the Australian dollar on Thursday, in line with the current downtrend (lower since February 2021). Weekly support at $0.6351-0.6468 (Fibonacci support) and daily support at $0.6401 is currently under attack and communicating a vulnerable position. Higher timeframe resistance to be mindful of resides on the weekly timeframe at $0.6673 and on the daily scale from $0.6678.
According to the H1 timeframe, you will note buyers and sellers are battling for position around the $0.64 psychological figure. Prime resistance coming in at $0.6446-0.6440 is overhead and well positioned to receive sellers should short-term buyers continue to defend $0.64 (beneath here shines light on Quasimodo support at $0.6352). Also of technical relevance, of course, is the bearish pennant pattern between $0.6363 and $0.6531. It had its lower side breached heading into US trading yesterday, action suggesting follow-through selling could be on the table. The profit objective for the pennant pattern is located as far south as $0.6137.
Technical expectation:
A technically bearish vibe is evident in this market. Weekly and daily support areas are on the verge of ceding ground, together with the H1 timeframe tunnelling through the lower edge of its pennant pattern.
Therefore, traders will likely be monitoring the two following scenarios. First, selling continues and H1 manoeuvres under $0.64, opening the door for breakout sellers to take aim at H1 Quasimodo support from $0.6352. Alternatively, a rebound from $0.64 unfolds and shakes hands with H1 prime resistance at $0.6446-0.6440, an area perhaps welcomed by short-term sellers.
USD/JPY
Although largely confined within a near-two-week trading band since 26th September between ¥145 and ¥144 on the H1 scale, price is seen testing the upper limit of this range, as we write. Outside of this area, Quasimodo support and resistance levels warrant attention at ¥143.67 and ¥145.40, respectively, with a 100% projection residing at ¥145.69 (an AB=CD bearish pattern).
The technical landscape on the bigger picture—the weekly and daily timeframes—remains unmoved. Therefore, the following text highlights where I left the charts heading into Thursday’s sessions (italics):
The weekly timeframe’s price action continues to cement position north of support at ¥137.23, inching towards forging a fresh 24-year high with scope to climb to weekly Quasimodo resistance at ¥146.79 (in line with the current primary bull trend). Note that directly above the aforementioned resistance resides a weekly 100% projection at ¥149.66 (an AB=CD bearish pattern). In terms of supportive structure, daily support falls in at ¥139.55, closely followed by weekly support at ¥137.23.
Interestingly, the daily timeframe’s relative strength index (RSI) ventured outside of its overbought territory (70.00) and is establishing what I see as early bearish divergence (negative divergence). This informs market participants that upside momentum is slowing and that a spike into weekly Quasimodo resistance could trigger a bearish scenario.
Technical expectation:
Weekly Quasimodo resistance at ¥146.79 is a level that traders are likely to have on their watchlists in light of the slowdown in momentum.
More immediate, nonetheless, between H1 Quasimodo resistance at ¥145.40 and the H1 100% projection at ¥145.69, this area delivers a possible ceiling to be aware of in the event of a ¥145 breach to the upside (buy-stops tripped north of the psychological level could induce a stop-run and, by extension, a bearish scenario from ¥145.69-145.40). However, it is important to remember the overall trend faces north, thus any bearish assault may be short-lived.

GBP/USD
Sterling posted a dismal performance against major G10 peers on Thursday, with GBP/USD extending Wednesday’s 1.3 per cent decline. Solid USD performance, rising US Treasury yields, upbeat Fed commentary, alongside the UK government tax U-turn and the recent Fitch downgrade all collectively weighed on the pound.
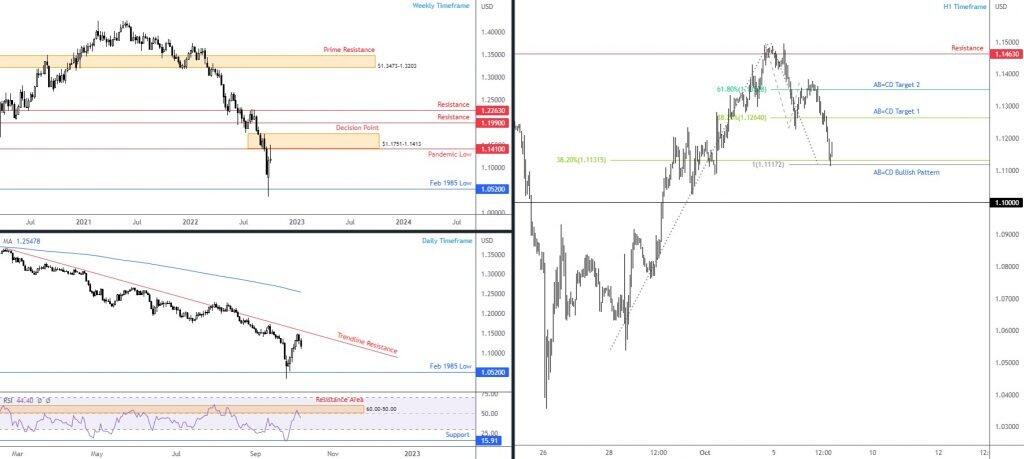
The technical positioning of the GBP/USD—longer term—reveals a bearish trend. The currency pair has been lower since February 2021 and recently touched gloves with the lower side of a resistance at $1.1410 and a neighbouring decision point at $1.1751-1.1413, which houses a daily trendline resistance, extended from the high $1.3639. The daily chart also shows the relative strength index (RSI) rejecting indicator resistance forged from 60.00 and 50.00 (a common sight in downtrends).
Against the backdrop of the higher timeframes, the H1 timeframe has seen price action rebound from a 100% projection at $1.1117 (an AB=CD bullish pattern) and a 38.2% Fibonacci retracement from $1.1132. Those familiar with AB=CD patterns, the 38.2% and 61.8% Fibonacci retracements (at $1.1264 and $1.1352, respectively), are frequently employed as upside targets after a test of an AB=CD bullish base. As you can see, should we voyage beyond the noted Fibonacci levels, resistance is seen at $1.1463, whereas beneath the current AB=CD will likely see price call on $1.10.
Technical expectation:
The weekly decision point at $1.1751-1.1413 (merging with daily trendline resistance) and the $1.1410 resistance on the weekly chart, in addition to daily RSI resistance between 60.00 and 50.00 places a (technical) bearish light over this currency pair.
For that reason, any upside attempts from the H1 AB=CD bullish base ($1.1117) are likely to be fleeting, and could motivate bearish positions from the H1 Fibonacci retracements at $1.1264 and $1.1352 noted above.
Author

Aaron Hill
FP Markets
After completing his Bachelor’s degree in English and Creative Writing in the UK, and subsequently spending a handful of years teaching English as a foreign language teacher around Asia, Aaron was introduced to financial trading,


