Lower unemployment with meager job growth? Yes, that can happen, here's how and what it means for markets

The data published by the US Bureau of Labor Statistics (BLS) on January 7 showed that Nonfarm Payrolls (NFP) rose by 199,000 in December, compared to the market expectation of 400,000. Regardless of the disappointing reading, the unemployment rate declined to 3.9% from 4.2% in November and came in better than analysts’ estimate of 4.1%.
Similarly, the unemployment rate in November dropped to 4.2% from 4.6% despite an NFP increase of only 249,000 in that period.
Usually, weak NFP figures have a negative impact on the greenback’s performance against its major rivals but the US Dollar Index didn’t suffer any noticeable losses after the last two releases. The primary reason behind this atypical market reaction was the fact that the market pricing of the Fed’s rate outlook wasn’t affected in a meaningful way. Rising wage inflation and the steady fall in the unemployment rate are seen as factors that would allow the Fed to prioritize inflation control and stay on a monetary tightening path.
Back in June 2021, NFP surged by 962,000 but the unemployment rate rose to 5.9% from 5.8% in May. How is it possible that the unemployment rate declines on a much smaller increase in payrolls? More importantly, what does that discrepancy mean for the markets? In this article, we will try to answer these questions.
CPS vs. CES
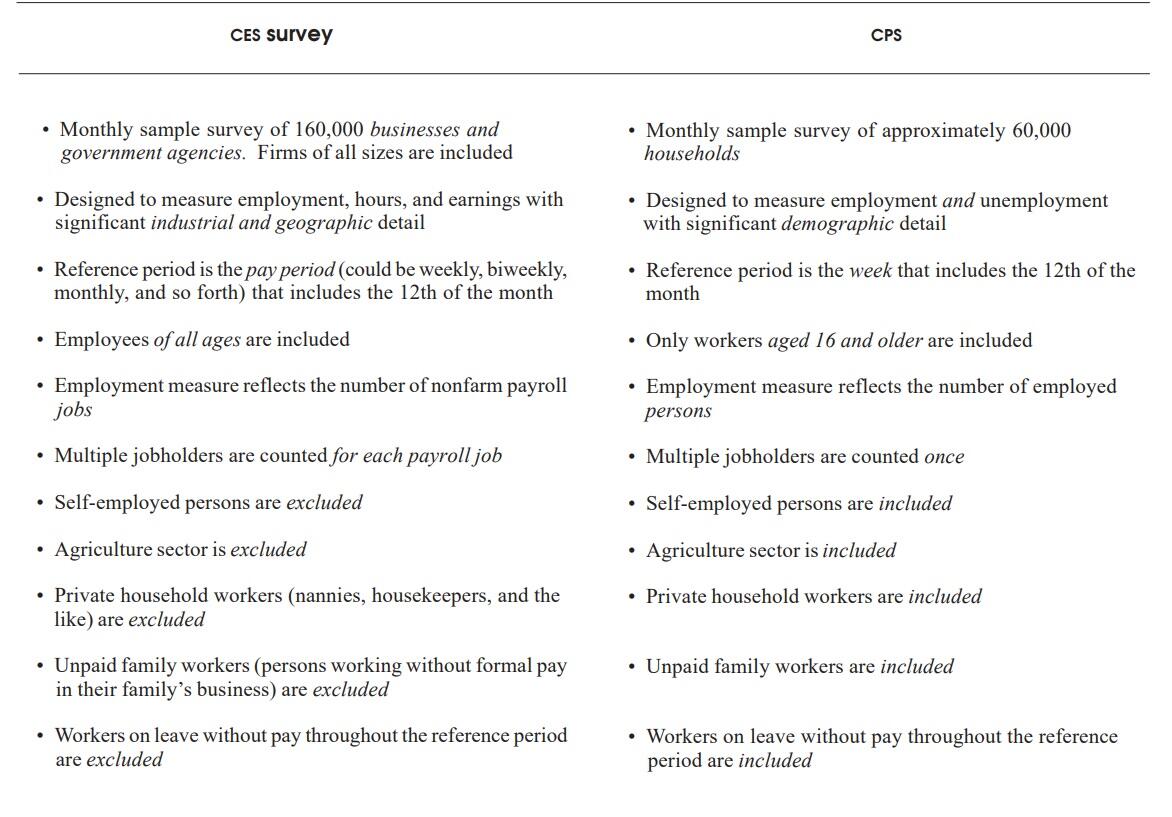
The BLS conducts two surveys every month to assess the labor market conditions: The Current Population Survey (CPS), also known as the household survey, and the Current Employment Statistics (CES) survey, also known as the payroll or establishment survey.
The unemployment rate is derived from the CPS while the NFP is a product of the CES.
The BLS explains:
“The payroll survey (CES) is designed to measure employment, hours, and earnings in the nonfarm sector, with industry and geographic detail.”
“The household survey (CPS) is designed to measure the labor force status of the civilian noninstitutional population with demographic detail.”
There are distinct differences between those two surveys and identifying them would be a good place to start.
Source: bls.gov
In simple terms, the CPS uses a broader definition of “employment” and looks at the number of people who work, while the CES intends to measure the change in the number of jobs.
Calculating unemployment rate and NFP
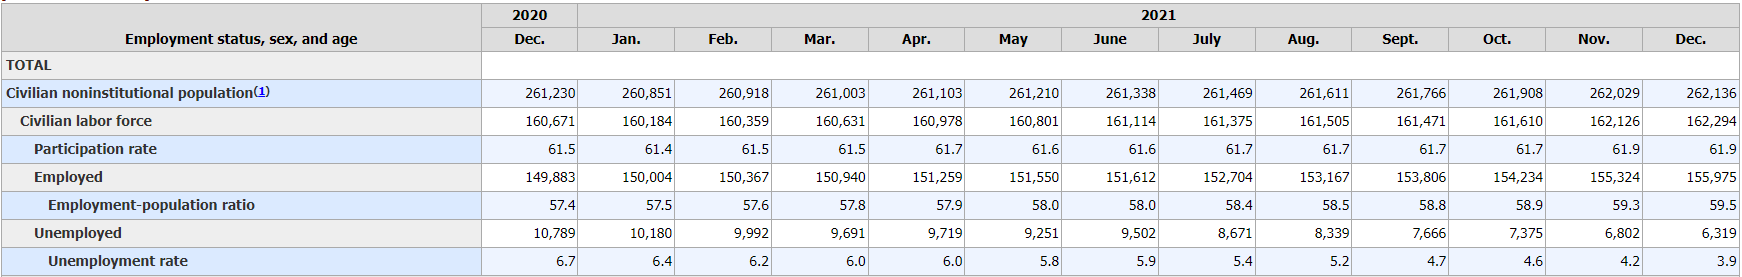
In order to calculate the unemployment rate, the BLS uses the number of people who were in the “civilian labor force” in the survey period and the number of people who were “unemployed” which can be seen in the table below.
Source: bls.gov (numbers in thousands)
In December, 6,319,000 out of 162,294,000 people in the labor force were unemployed, producing an unemployment rate of 3.9% ((6,319,000*100)/162,294,000).
There are several other key figures that we need to look at:
Participation rate: The ratio of “civilian labor force” to “civilian noninstitutional population.” In December, the “civilian noninstitutional population” was 262,136,000 and there were 162,294,000 people in the “civilian labor force,” producing a participation rate of 61.9 % ((162,294,000*100)/262,136,000).
An increase in the participation rate could be reflected in the unemployment rate. In a case where the number of people who come into the labor force increases at a stronger pace than the number of people who get employed in that period, a rising participation rate could translate into a higher unemployment rate and vice versa. Nevertheless, that wasn’t the case in December as the participation rate remained unchanged at 61.9%.
Employment-population ratio: This one is pretty self-explanatory. The employment-population ratio rose to 59.5% ((155,975,000*100/262,136,000) in December from 59.3% in November, suggesting that a larger portion of the civilian population is employed when compared to the previous month.
An increasing employment-population ratio while the participation rate remains steady could be seen as a positive development in the labor market.
Finally, the headline NFP represents the change in the total number of nonfarm payrolls in the CES. In December, total payrolls increased by 199,000 to 148,951,000 from 148,752,000 in November.
Adjusted CPS employment
In order to make sense of the difference in employment numbers in the CES and the CPS, the BLS calculates a separate employment figure called “adjusted household survey employment.”
The table and the chart below show how the NFP, CPS employment and the adjusted CPS employment compare in the last 12 releases.

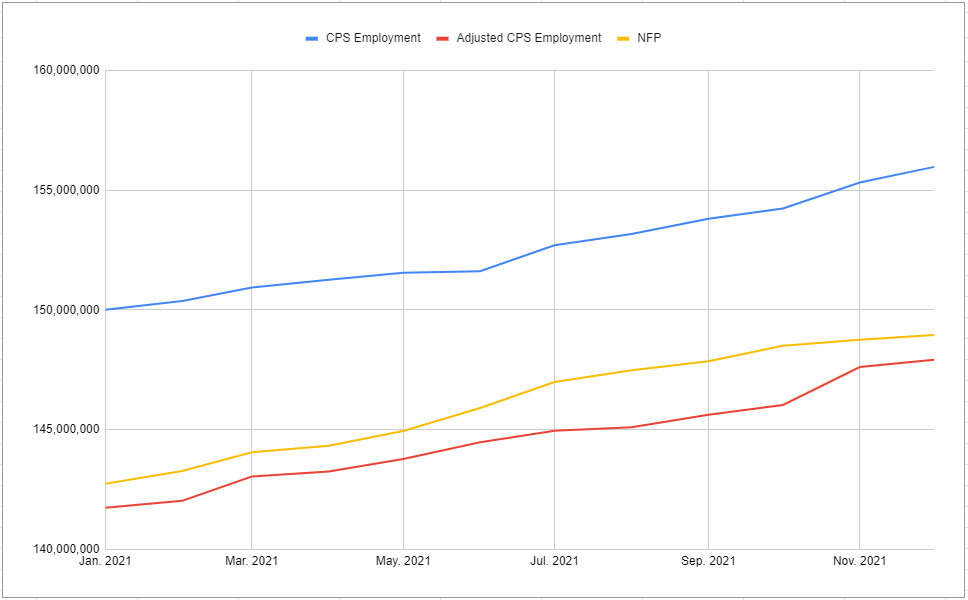
As illustrated in the chart, the adjusted CPS employment (red line) tracks NFP (yellow line) much closer than the CPS employment (blue line) does.
Here is how monthly changes in the NFP and the adjusted CPS employment compare:

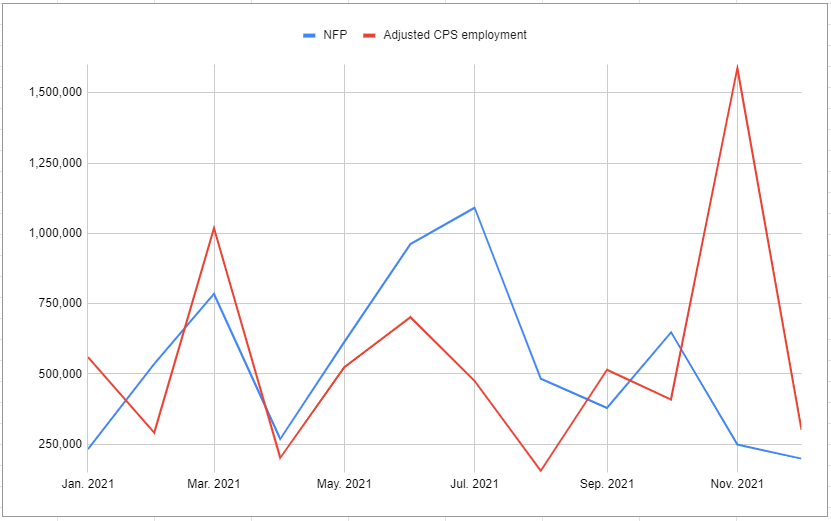
In July 2021, NFP was 1,091,000 and the adjusted CPS employment was 475,000. On the flip side, these figures were 249,000 and 1,588,000 respectively, in November. The biggest divergences between the monthly changes occurred in these two months in 2021.
How does the BLS come up with the adjusted CPS employment figure?
The BLS subtracts “agriculture and related employment,” “the unincorporated self employed,” “unpaid family workers in family owned businesses,” “workers in private households” and “nonagricultural wage and salary workers on unpaid leave” readings in the CPS from the main total employment figure (not seasonally adjusted) and adds the “nonagricultural wage and salary multiple jobholders.” Finally, the outcome is seasonally adjusted.
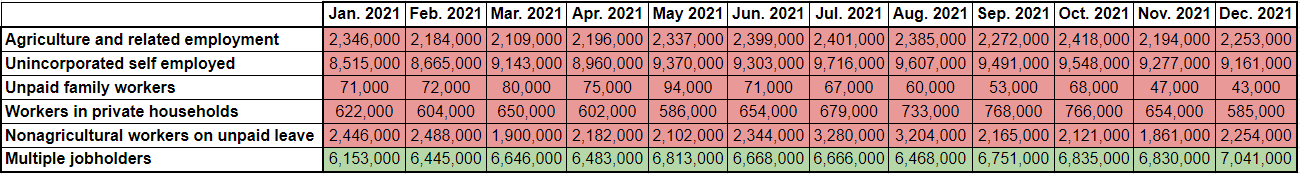
Let’s take a closer look at what caused the above-mentioned differences in the NFP and adjusted CPS employment monthly changes in July and November.
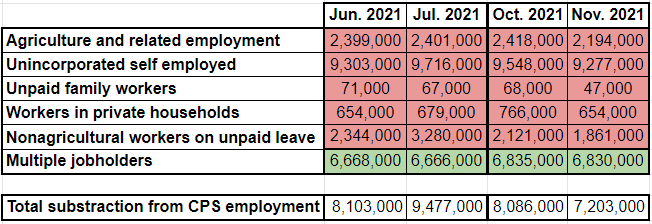
From June to July, every category that is subtracted increased while the opposite happened from October to November. Changes in the “multiple jobholders” category, which is added, were relatively small. Total subtraction from the CPS employment figure jumped to 9,477,000 in July from 8,103,000 in June while it dropped to 7,203,000 in November from 8,086,000 in October.
Other factors
As presented above, there is still some divergence between NFP and the adjusted CPS employment caused by several other factors, some of which are listed below.
- The CPS is subject to a bigger sampling error than the CES because of its much smaller sample size.
- The inclusion of new businesses or the exclusion of business closures are reflected in the CES survey with a lag.
- Workers who are paid "off-the-books" are not reported in the payroll survey.
- Benchmark to the payroll survey estimation process is revised annually.
Market implications
It is difficult to say which survey paints a more accurate picture of the labor market. Long-term trends are usually more important for the Fed when it comes to conducting its monetary policy.
A steady decline in the unemployment rate, even when the NFP growth falls short of expectations, could be seen as a convincing sign pointing to an improving jobs market. On the other hand, strong NFP prints might not be enough to satisfy policymakers unless accompanied by a healthy participation rate and an employment-population ratio.
While testifying before the US Senate, FOMC Chairman Jerome Powell stated that they need to focus more on the inflation goal than the maximum employment goal. Wage inflation, as measured by average hourly earnings, will be the key component of the jobs report to watch in the near term.
Premium
You have reached your limit of 3 free articles for this month.
Start your subscription and get access to all our original articles.
Author

Eren Sengezer
FXStreet
As an economist at heart, Eren Sengezer specializes in the assessment of the short-term and long-term impacts of macroeconomic data, central bank policies and political developments on financial assets.


