Loonie attempts to hold above 1.4150

Roughly 75% of Canadian exports go to the US, giving the pair unusually high sensitivity to bilateral trade policy. Canada’s traditional strengths include large energy and mining exports, a stable banking system, and close integration with the US economy under USMCA, but Canada’s economy is heavily tied to energy exports, so when oil prices rise, demand for CAD increases alongside export revenues, while falling oil tends to weaken the Loonie.
As of early July 2026, USD/CAD trades around 1.417, with the pair capped by fading oil support and lingering USMCA termination uncertainty. The USMCA (United States-Mexico-Canada Agreement) is the trade deal that replaced NAFTA (the North American Free Trade Agreement) in 2020, after being renegotiated during Donald Trump’s first term. It governs trade rules between the three countries — tariffs (or the absence of them), rules of origin for goods like autos, labor standards, agriculture, digital trade, and dispute-resolution mechanisms. The recent CAD weakness largely reflects trade-policy risk and a soft domestic backdrop: the USMCA joint review milestone in July 2026 is a key uncertainty hanging over CAD markets, with any escalation of trade tensions capable of putting renewed downward pressure on the Loonie, while Canada’s deteriorating real growth profile and unfavourable Canada-US 2-year yield spreads have made the loonie one of the weakest reserve currencies in recent weeks.
Technical analysis
The Canadian dollar (CAD) has weakened by 4.38% since May 1, when USDCAD bottomed at 1.3550, to yesterday’s settlement at 1.4168. Its correlation with the energy sector—particularly crude oil—and, more broadly, with weakness across the commodities complex is quite natural for the currency. In fact, several other USD pairs have also returned to levels last seen in April–May 2025, including EUR/USD and GBP/USD, so in that sense the Loonie is not an exception.
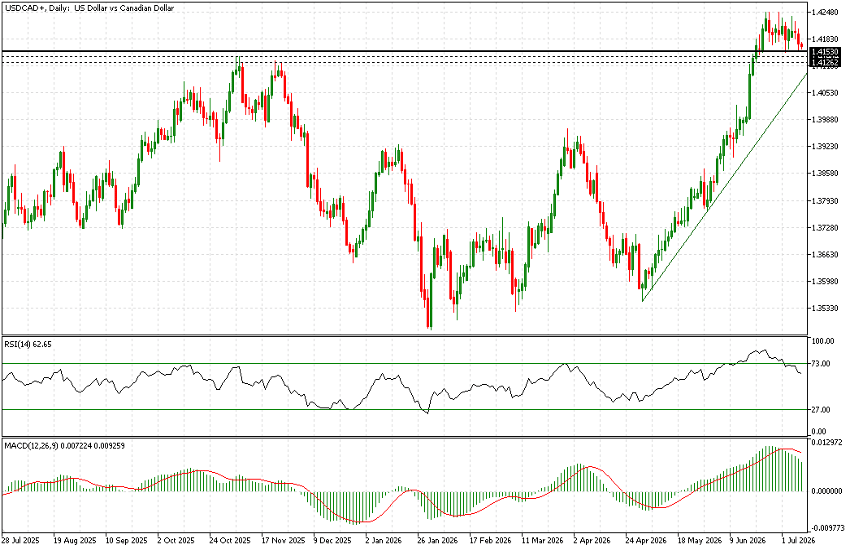
What we do find particularly interesting is the current technical setup. The chart shown is the Daily USD/CAD. The two dashed support levels at 1.4140 and 1.4125 correspond to the previous highs from October and November 2025, which acted as strong resistance and ultimately pushed the pair back toward 1.3550. Over the past two weeks, however, those levels have been broken to the upside and successfully retested several times.
The recent low actually came in at 1.4153, but the broader 1.4125–1.4155 area is now well defined. This zone needs to hold and is attempting to establish itself as a solid floor. Should it fail, however, there is room for further downside, with the first target being the uptrend line in place since April, which currently comes in around 1.4085. Meanwhile, the RSI is retreating from overbought territory, while the MACD is also showing signs of losing momentum.
There is another interesting factor worth highlighting, although it is only visible on a 10-year weekly chart. Throughout this millennium, USD/CAD has spent very little time trading above its current levels. Although the pair briefly rallied to around 1.48 in early 2025, that move lasted only about a quarter before being fully retraced, with the exchange rate returning to what could be considered a more normal trading range.
Author

Marco Turatti
Independent Analyst
More than 10 years of experience in institutional trading, several years in retail brokerage as a Market Analyst and Head of Dealing.