Look out for sterling volatility on UK Q3 GDP

Market Overview
The corrective sentiment across markets continues with the lower oil price and equity markets lower. However there is a big focus on sterling volatility and UK assets today as the first reading of UK Q3 GDP growth is released. This is the first full quarter in the post-Brexit era and although the data is likely to be subject to sizeable revisions, this first reading could be crucial. In the immediate aftermath of the referendum, the Bank of England expected Q3 growth to be just +0.1%, however this number is forecast by consensus to be at +0.3% which whilst below the long run average of +0.5% (since the end of the financial crisis), this would still be considered a fairly decent showing. Sterling is likely to be a big volatility factor today as a number at or over consensus could lead to the Bank of England pulling back from a potential further easing of monetary policy in November.

Wall Street closed marginally weaker again with the S&P 500 down -0.2% at 2139, whilst Asian markets followed suit with the Nikkei -0.4% and European markets in a similar fashion in early moves. In forex trading, sterling has given back some of yesterday’s gains ahead of the key UK growth data, whilst the dollar is showing little real direction today. Gold and silver are holding their ground, whilst oil is still clinging on to key near term support and is trading slightly higher on the day.
Traders will certainly be looking out for the first reading of UK Q3 GDP at 0930BST (+0.3% QoQ exp). The US releases core Durable Goods Orders at 1330BST with a slight improvement of +0.2% on an ex-transport basis expected. Weekly jobless claims are also at 1330BST and are expected to be at 255,000. Pending Home Sales are at 1500BST and are expected to grow by +1.2%.
Chart of the Day – Silver
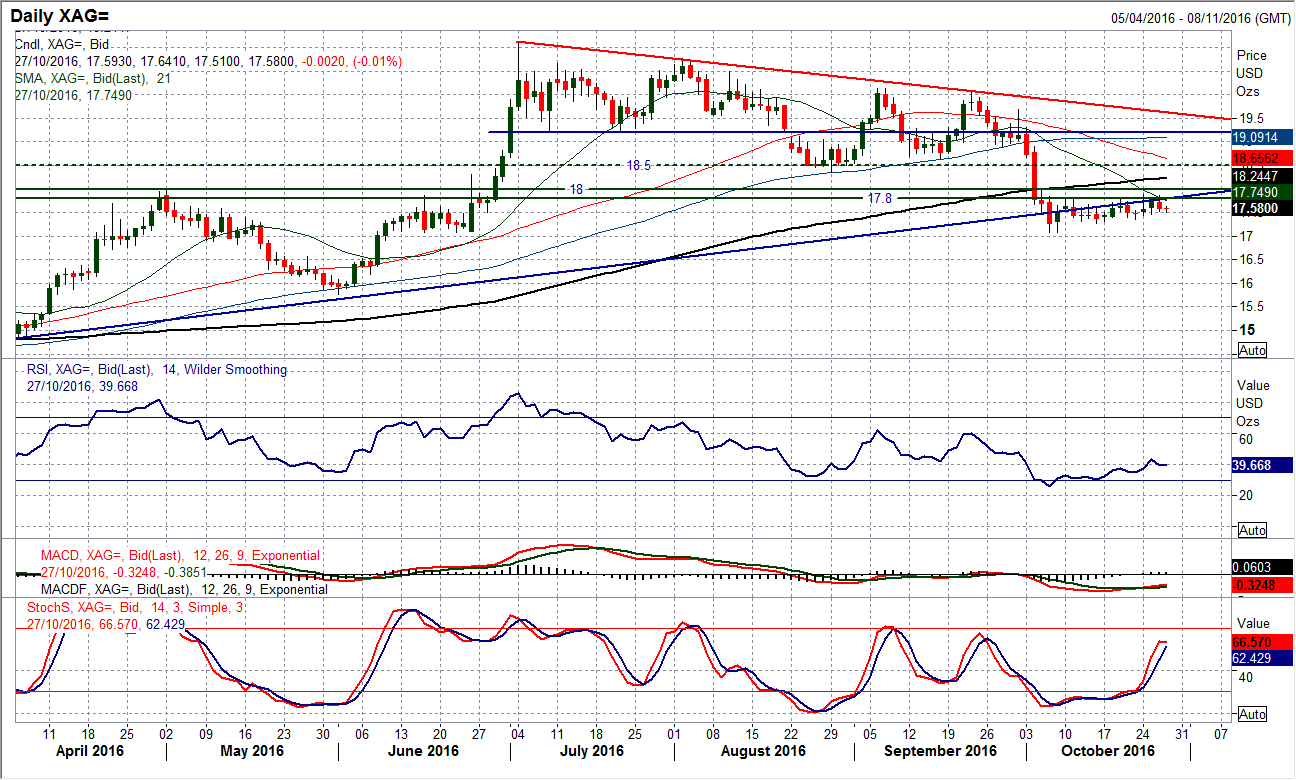
The gold price has been steadily building a rally but it is interesting to see that silver has been lagging in the recovery stakes. This could have implications for market risk appetite as silver tends to outperform gold during a more risk positive trading environment. The concern is that the medium term outlook is now more corrective on silver and rallies will be seen as a chance to sell. The creep higher has really struggling to break through the resistance band of the old key highs between $17.80/$18.00 and the importance of this is growing with this resistance now key for the near term outlook. Yesterday’s bear candle has dragged on the momentum and the recovery is really struggling now. A rally on a closing basis through $18.00 would open a recovery towards $18.50 but even this is a key area of overhead supply in the October sell-off and would likely restrict the bulls. The hourly chart shows that the rally is not secure and a drop below $17.47 support would turn the outlook more corrective again and a breach of $17.35 would be negative.
EUR/USD
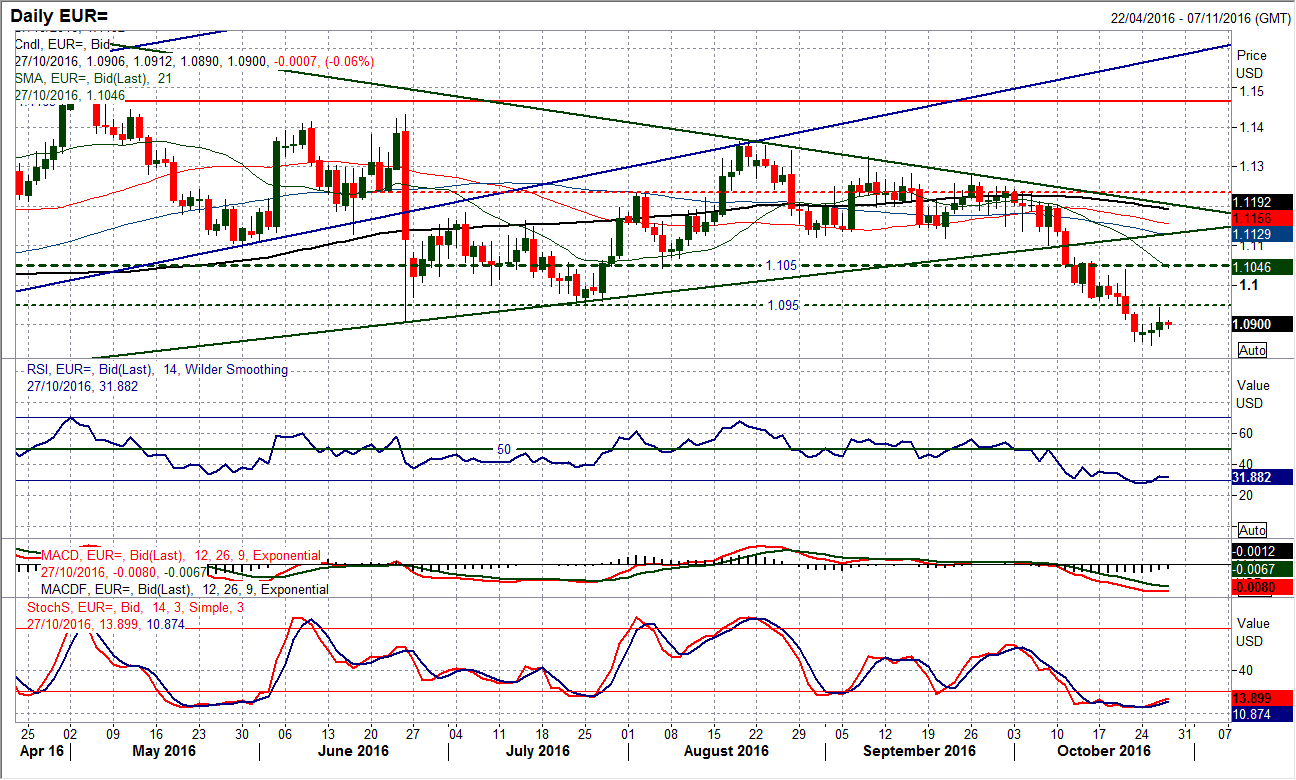
The dollar correction has allowed the pair to rally in the past few days. However the overhead supply around $1.0950 will be a key level of resistance that will be difficult to overcome now. Yesterday’s positive candle ended up closing around the mid-point of the session after a move higher failed at $1.0945 just under the resistance. This suggests that the bulls still have a degree of control but the initial failure will be a concern now. Today’s early consolidation is also reflecting the uncertainty in the ability of the bulls to continue the recovery. The momentum indicators have picked up marginally but are struggling to really get going, which is another sign that this is a rally that will falter around such key resistance. The hourly chart shows this is more of a consolidation move. I am looking to use rallies as a chance to sell to retest the $1.0848 low and eventually towards $1.0800. There is a key near tm medium term sell zone now between $1.0950/$1.1050.
GBP/USD
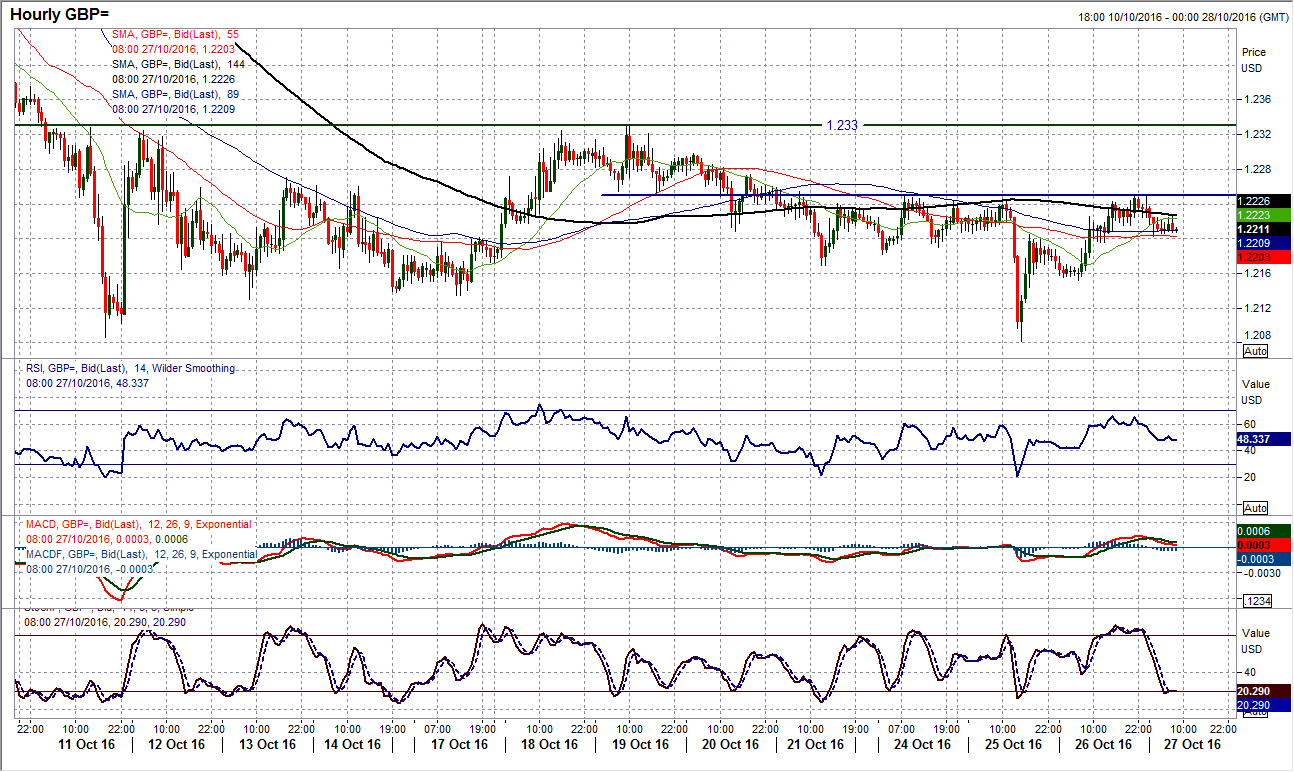
Sterling continues to trade in the sideways range. The previous brief breach of support was certainly not enough to suggest the bulls have thrown in the towel quite yet and the low at $1.2080 is now key Yesterday’s bull recovery candle added 60 pips and once more helps to bolster the support. Daily momentum indicators have enough in them to suggest that this is a range play now with the RSI around a three week high and the MACD lines having crossed higher. On the hourly chart, now the market has calmed down following Tuesday’s spike lower it is almost back to where we were at the beginning of the week with a consolidation that is trying to battle to break above the resistance at $1.2250. This has been a barrier since Friday and continues to prevent further recovery within the range. Minor support at $1.2150 formed yesterday and there is a sense that the bulls are looking to continually test $1.2250, with a breach opening the key resistance at $1.2330. Sub $1.2150 re-opens the key support at $1.2080.
USD/JPY
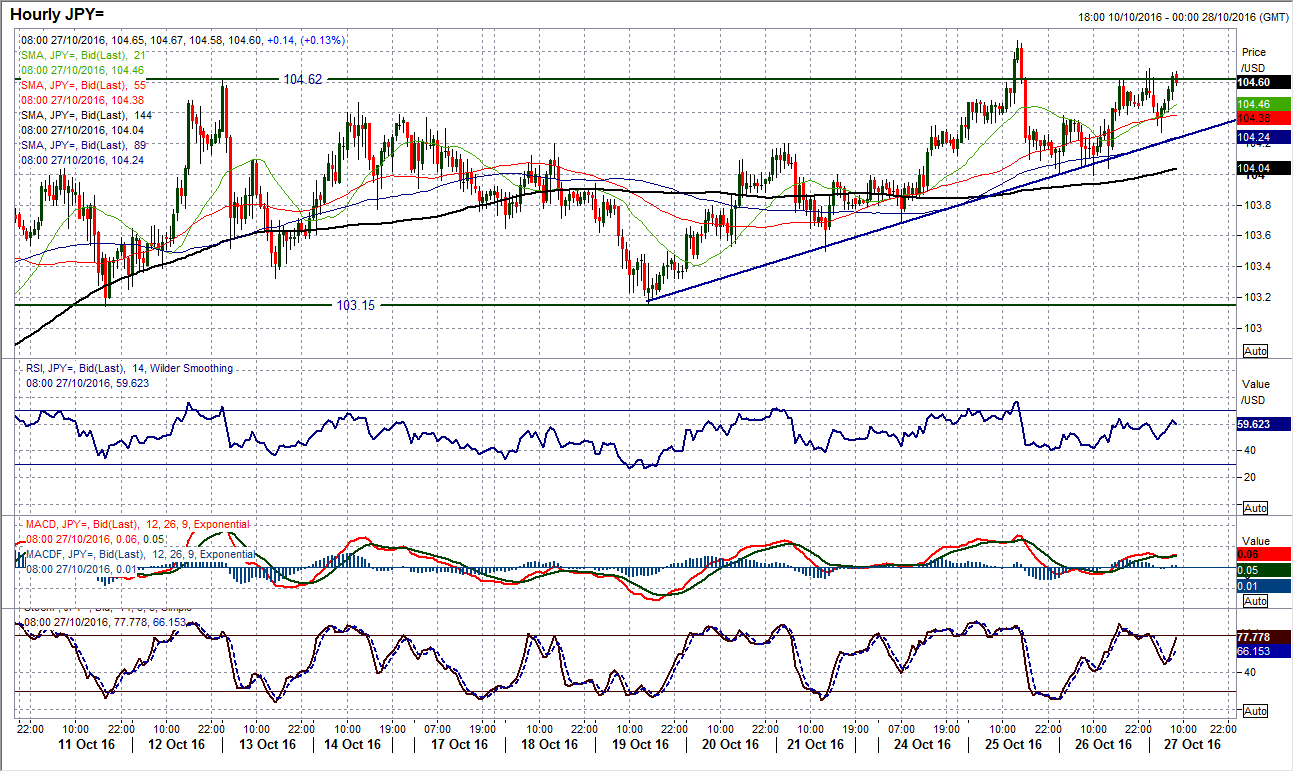
Has the close above the 104.30 finally broken the shackles? For the past couple of weeks the market has struggled with intraday tests but unable to make the final breakout, however now yesterday the bulls have managed to achieve the closing breakout above the old September high. This should now help to give the bulls more confidence to push on. There is still a positive configuration in the momentum and now we need to see the RSI pulling decisively clear of 60 and ideally the daily Stochastics crossing back higher too. The hourly chart shows a seven day uptrend intact and pulling higher, whilst the hourly RSI continues to find support above 40 and maintain the recent positive momentum. Initial resistance is at 104.87 which was Tuesday’s high, but with the improving outlook once more the bulls will be eying bigger resistances overhead, with 105.50 an old pivot and more importantly 107.45. Initial support is at 104.00 with 103.50 and now 103.15 key.
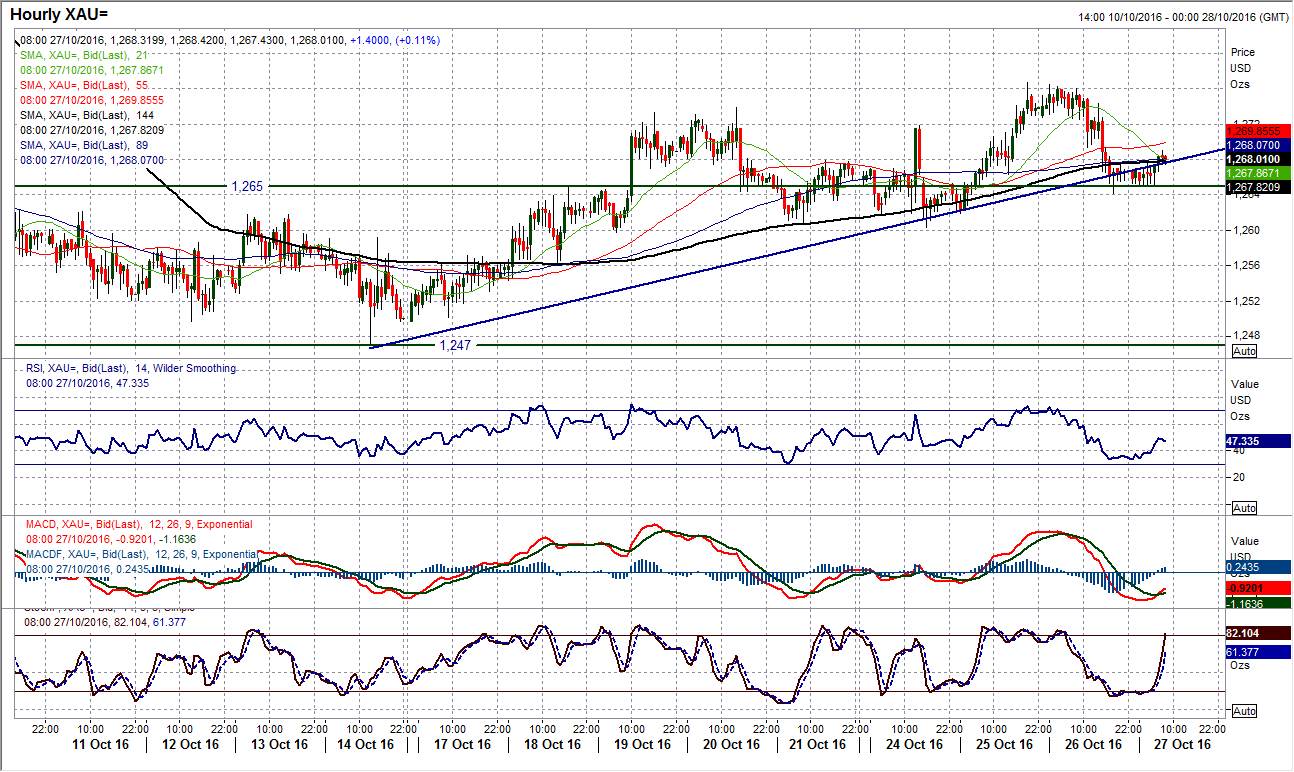
Gold
Gold may have struggled yesterday but the outlook for the near term recovery remains positive. The initial move above $1265 still means a base pattern that targets $1283 and near term dips continue to be bought into. The daily chart shows that there has been a minor blip in the outlook with yesterday’s corrective candle and this has just checked the recovery in the momentum. It does now mean that today’s session will be important as a second consecutive negative candle could impact on the rally. The neckline support of the base patter is at $1260 and this has already been a basis of support for this pullback, as shown on the hourly chart. Moving into the European session today the support is holding and the hourly momentum indicators are encouragingly crossing higher. Whilst the support at $1260 remains intact the near term bulls will still be in control. The hourly chart shows that corrections are being bought into. There is resistance at $1277 as this has been tested on several occasions in the past couple of days.
WTI Oil
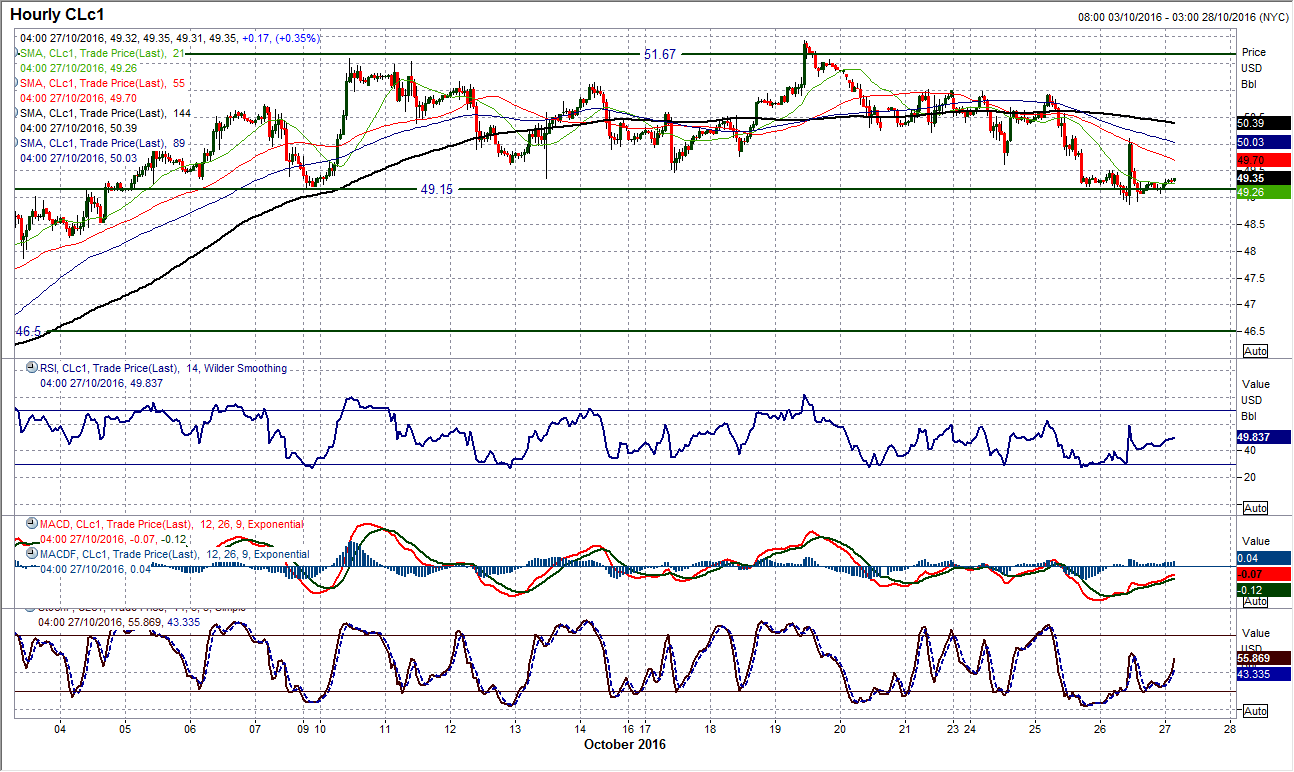
The EIA oil inventories saved the oil price from a near term breakdown yesterday. The support at $49.15 had been breached on an intraday basis yesterday, but a rebound was seen following the surprise inventory drawdowns in the EIA report on all of crude, distillates and gasoline stocks. This spiked the price higher by over 2%, and although the move was retraced, the bulls are still hanging on by a thread. However this support may only be temporary as the pressure remains on the support at $49.15 today and a closing breakdown would complete a small top pattern. This developing corrective outlook is reflected on the momentum indicators with the deterioration in the daily studies (RSI, Stochastics and MACD lines all having recently given corrective or near term sell signals), whilst the hourly chart also shows a negative configuration. The spike higher has left near term resistance at $50.10 with the resistance stronger at $51.00 and rallies should still be seen as a chance to sell. A close back below $49.15 would complete a near term top pattern and imply a drop back towards $47.70.
Author

Richard Perry
Independent Analyst


