LNG turns systemic as Europe absorbs mounting structural stress
- European LNG flows mask rising fragility across the network
- Shipping and bunker stress leak into gas through the transmission channel
- Price stability hides a system that is tightening under structural pressure

Market context shift
LNG is entering a regime where the price no longer reflects the condition of the system. The calm surface of natural gas stands in contrast to the tension building across flows shipping and bunker markets. The shock has already entered the network and desks are now pricing the consequences of logistical strain rather than the commodity itself.
The architecture of stress
European LNG flows appear orderly at first glance. Total EU intake sits at 509.54 million cubic meters with a modest positive shift. Yet the structure beneath the headline is tightening. The top three terminals control almost a third of all flows and the Herfindahl Hirschman concentration index signals an oligopolistic configuration. This is not a flexible network. It is a system that channels pressure into a few critical nodes.
The data comes from the European Master Report dated 08 April. It captures a moment where the network is still holding but already creaking. Italy registers no LNG entries in the snapshot. Germany sits on thin storage. The load is carried by a handful of coastal hubs that absorb volatility while the rest of the system depends on their stability. This is where the stress begins.
How stress leaks into the system
The transmission mechanism is no longer theoretical. Shipping congestion bunker scarcity and insurance repricing are pushing tension directly into LNG logistics. The Shipping Radar shows extreme stress across freight flows and risk metrics. Heating oil surges more than four percent. Bunker markets face a supply squeeze with no equivalent in recent memory.
The Transmission Signal Index which measures how stress leaks from shipping into gas prices stands in active transmission. Oil and bunker components rise while gas remains soft. The divergence reveals the real story. The cost of moving LNG is rising even as the front month stays calm. The system is absorbing the shock through logistics rather than through the curve.
The fragile equilibrium
Terminal behaviour exposes the pressure points. The primary hub for volumetric balancing TVB expands sharply. Zeebrugge and Dunkerque contract. Montoir Sagunto Baltic Energy Gate Ravenna and OLT Livorno break out. These shifts are not noise. They are the map of where the system is bending to maintain equilibrium.
Storage deepens the divide. Portugal sits above ninety percent. Spain approaches sixty percent. Italy holds near forty four percent. Germany remains near twenty three percent. Europe is not a unified gas system. It is a patchwork of buffers and vulnerabilities. The imbalance forces flows to reroute through the same stressed corridors that shipping is already struggling to maintain.
This is a fragile equilibrium. It holds only because the network has not yet faced a second shock.
Stress across connected markets
The shock propagates across oil metals freight and macro indicators. Brent rises. Heating oil leads the complex. LNG shipping equities fall more than two and a half percent. Dry bulk weakens. Crude tankers retreat. Product tankers resist the pressure. The divergence shows that markets are repricing access conditions rather than availability.
The Dollar softens and volatility declines. These moves support the calm in gas futures but do not relieve the operational tension. Desks are no longer trading gas. They are trading infrastructure resilience.
Asia session and positioning behaviour
The Asia session reveals how global desks are managing exposure. Price action remains controlled. LNG trades within a narrow band. There is no disorderly adjustment. This is the behaviour of a market that is reducing leverage while keeping core positions intact.
The shock has been absorbed. Its consequences continue to shape pricing. The system is in a regime where the next move depends on logistics rather than demand.
Cross asset evidence
The European Master Report shows a network that is balanced in headline terms and strained in structural terms. Concentration high load on a few terminals and uneven storage create a system that can function but not relax. The calm in price is not a sign of stability. It is the silence of a system that is working harder than it should.
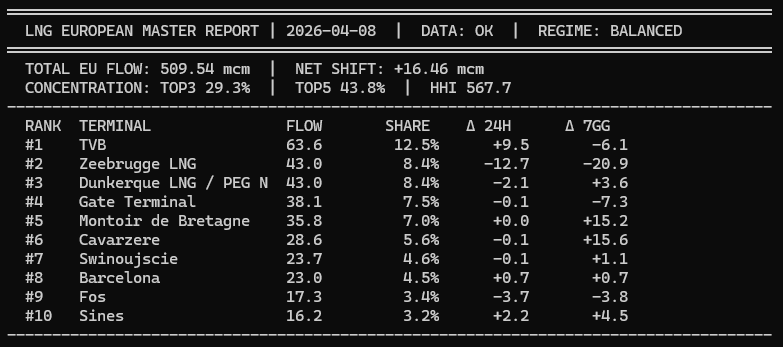
This evidence supports the view that LNG is the asset through which the market reads the condition of the European energy network. The price is calm because the system is absorbing the shock through logistics rather than through the futures curve.
Technical structure
The technical structure shows a market in compression. Price rotates around the pivot near 2.78 which becomes the centre of gravity for the current phase. The Renko sequence highlights alternating blocks with no directional follow through and confirms the loss of acceleration after the previous impulse.
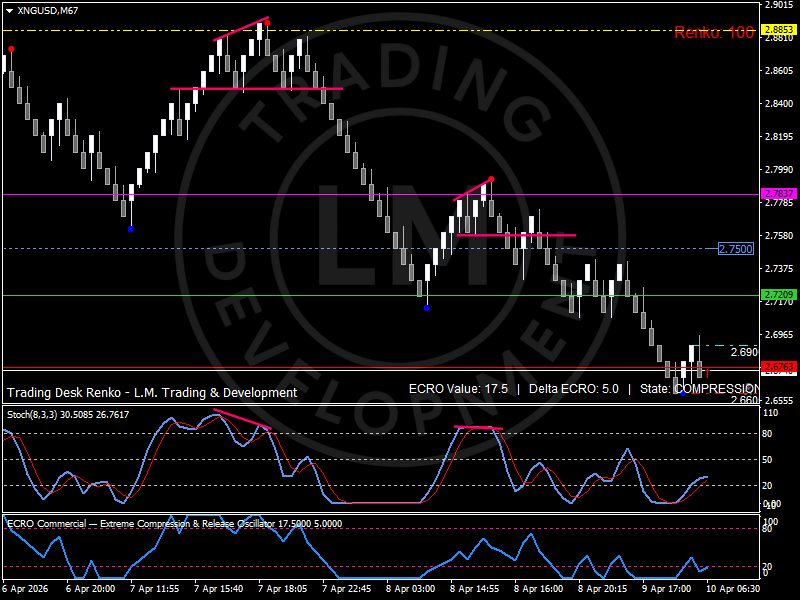
Resistance forms near 2.88 where attempts to extend have stalled. Support holds between 2.71 and 2.67 and the broader structure remains intact. The range is narrow and the market is waiting for alignment between flows shipping and macro conditions.
Momentum indicators confirm the slowdown. The ECRO momentum indicator remains elevated with a positive delta that reflects residual energy without direction. The oscillator rolls lower from mid levels and signals a controlled deceleration.
The market remains in compression with structure intact and momentum capped by operational pressure.
Conceptual synthesis
LNG has become the lens through which the market reads the condition of the European energy system. The price is calm but the network is tense. Shipping bunker and flow dynamics define the regime. The dominant variable is the operational capacity of the infrastructure rather than the futures curve.
Outlook
LNG trades in a regime where price stability masks rising logistical risk. If shipping conditions stabilise and bunker costs ease, the market can rebuild pressure toward the 2.88 resistance band, supported by a more flexible infrastructure. If freight stress persists, the pivot near 2.78 becomes a ceiling and pressure will concentrate toward the 2.71 support area as the system tightens. A new disruption in flows or logistics would trigger a fast repricing, with the weakest nodes, including Italy’s absence in recent intake data and Germany’s thin storage, absorbing the shock first.
Author

Luca Mattei
LM Trading & Development
Luca Mattei is a market analyst focusing on FX, metals, and macroeconomic trends. He develops trading tools for retail and professional traders, coding indicators and EAs for MT4/MT5 and strategies in Pine Script for TradingView.