Lingering geopolitical uncertainty requires a crude rethink

2026 has started with a significant amount of geopolitical risk, buoying oil prices. These risks are likely to persist for some time, suggesting prices will remain better supported. Fundamentally, the market is also not as well supplied as expected, adding further support. We have revised our oil price forecasts higher.
Geopolitical risks and supply disruptions mean higher prices
The oil market continues to deal with lingering uncertainty over how the situation between the US and Iran evolves in the coming weeks and months. While there are efforts to find a diplomatic solution, the buildup of US military assets means there is the very real risk of significant escalation in the event a deal cannot be reached. The latest round of talks failed to lead to a deal; instead, further talks are scheduled, but we are moving dangerously close towards President Trump’s deadline for a deal. The market is pricing in a large risk premium due to this uncertainty; we believe as much as US$10/bbl.
However, it is also important to point out that the strength in the market is not entirely due to uncertainty over Iran. The market is not as well supplied as we initially expected. This is very evident when looking at the forward curve, with the backwardation suggesting the large surplus many were forecasting has not hit the market. Kazakh supply disruptions at the start of the year have tightened the market, while reluctance by some buyers to continue Russian oil purchases has meant that the unsanctioned market is tighter than what the overall oil balance suggests.
The uncertainty in the market, coupled with a tighter than expected balance, has also brought more speculative money into the oil market, with speculators buying more than 200k lots in ICE Brent since mid-December, leaving them with their largest position since April last year.
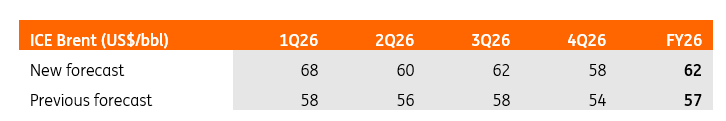
While we still expect oil prices to weaken this year on the back of a surplus, we have scaled back on how much downside we could see. We have revised our ICE Brent 2026 average price forecast from US$57/bbl to US$62/bbl. It is important to note that US military action in Iran would likely require these forecasts to be revised higher once again, particularly if there are disruptions to oil flows.
ING Oil price forecasts revised higher
Iran supply risks have the potential to be significant
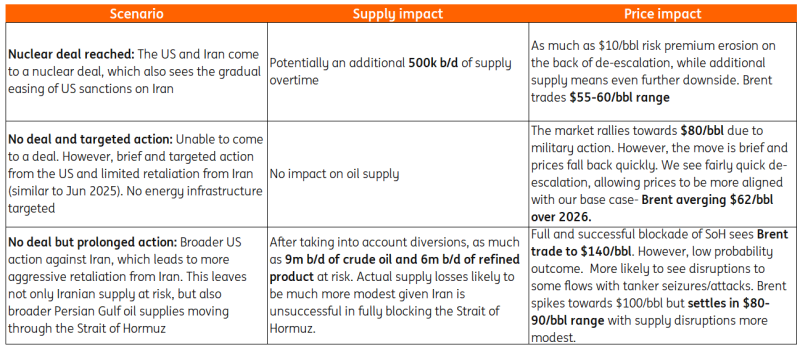
There are several layers of uncertainty when it comes to the ongoing talks between the US and Iran. The first is whether the two parties will be able to come to a nuclear deal. The US wants Iran to stop enriching uranium, as well as handover its enriched uranium, limit its ballistic missile programme and stop supporting proxies in the region. Iran claims its nuclear programme is for civilian purposes and wants to be able to continue with limited enrichment of uranium. There have been conflicting reports that the US may be willing to accept small levels of enrichment. In addition, if we are to get a deal, will this include an easing of US sanctions on Iran? If so, this would clearly be a bearish development for the market, with prospects for Iran to increase supply by as much as 500k b/d. While obviously opening Iranian crude to more markets than just China.
Assuming no deal, given the buildup of US military assets in the region, it is likely that we see the US taking some military action against Iran. President Trump already stated a maximum of 10-15 days to come to a deal, which would leave a deadline of early March. However, what is unclear is the extent of action the US is willing to take, and also the degree to which Iran retaliates. Brief and targeted strikes on nuclear/military sites and limited retaliation from Iran, as seen in June 2025, would likely see oil prices briefly spiking towards $80/bbl, but in the absence of oil supply disruptions, we suspect it would be a short-lived rally.
The bigger concern for the market would be more extensive strikes from the US, which are not limited to nuclear sites, potentially putting the Iranian oil supply at risk. This would suggest that the US is not just targeting an end to Iran’s nuclear programme but potentially targeting regime change. This would mean far more aggressive retaliation from Iran, which not only leaves Iranian supply at risk, but broader flows from the Persian Gulf, which pass through the Strait of Hormuz (SoH).
After accounting for potential diversions via pipeline, this still leaves in the region of 9m b/d of crude oil and 6m b/d of refined products at risk. Successfully blocking the SoH would leave significant upside to the market, potentially with Brent hitting $140/bbl, with supply losses unable to be offset. Higher prices would be needed to ensure demand destruction. However, a full and prolonged blockage of the strait would likely be unsuccessful, with any attempts to do so leading to a rapid response. Partial disruptions, which could include seizing or attacking tankers, would likely mean Brent spikes towards $100/bbl initially but settles in a largely $80-90/bbl range.
US-Iran nuclear deal scenarios
The Oil market is not as oversupplied as expected
The uncertainty over Iran has provided significant upside to the market so far this year. However, it would be wrong to assume it has been the only driver. The fundamentals are not as loose as we had expected coming into this year. Kazakh oil flows from the CPC terminal were disrupted at the start of this year, which saw crude loadings fall to a little over 900k b/d in January, down from a 2025 average of more than 1.5m b/d. These loadings are slowly recovering and could hit roughly 1.6m b/d in March, up from a planned 1.2m b/d in February.
But also importantly, India has been more reluctant to buy Russian oil following US sanctions and the introduction of the EU ban on refined product imports derived from Russian oil. The US trade deal with India, which sees the US dropping secondary tariffs on India in return for halting imports of Russian oil would have only added to this trend. Indian imports of Russian oil in January were in the region of 1m b/d, down from an average of 1.5m b/d in 2025. As a result, there has been a buildup of Russian oil at sea. However, we have seen discounts on Russian Urals widening in an attempt to entice buyers, and it seems to be working, with Chinese buyers taking advantage of widening discounts. If China can absorb Russian barrels which would have gone to India in the past, the impact on the market should be more limited. However, if not, it means that we are likely to eventually see more meaningful declines in Russian oil output. OPEC data already shows that between November and January, Russian crude output has fallen around 130k b/d.
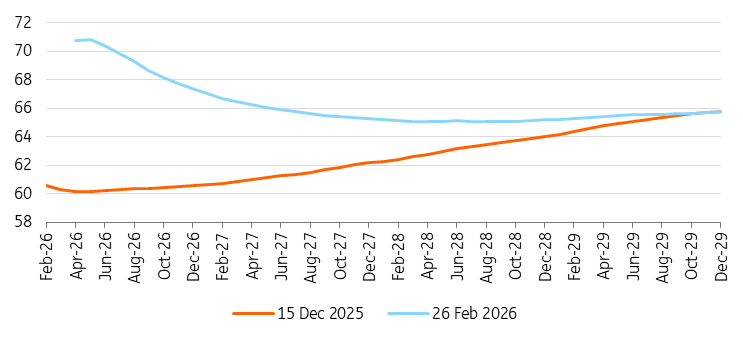
The tighter-than-expected market is well reflected in the ICE Brent forward curve. If the market were significantly oversupplied, the forward curve would not be in steep backwardation as we currently see. We would expect to see at least a flatter curve and possibly a curve in contango. The curve would need to incentivise the carry/storage of excess barrels.
Another factor which is proving supportive of the crude market is refinery margins. While they are off from the highs seen in November, seasonally they are still at healthy levels, which should continue to see relatively strong refinery runs. Margins have been supported by the middle distillate market, with underlying fundamentals somewhat supportive, while the US-Iran standoff also poses risks to middle distillate flows from the Persian Gulf.
The ICE Brent forward curve does not suggest an oversupplied market (US$/bbl)
OPEC+ likely to bring further supply to the market
The stronger flat price and timespreads mean we are likely to see OPEC+ resume supply increases from April. This is after having paused increases during the first quarter of the year due to seasonality in the oil balance.
We are likely to see the group announce a 137k b/d increase on 1 March. However, in reality, the actual increase is likely to be more modest, with members already producing below their target level in January. If the group continues with these gradual increases through the year, it could put some additional downward pressure on the market. But this really depends on whether we see de-escalation between the US and Iran.
Read the original analysis: Lingering geopolitical uncertainty requires a crude rethink
Author

Warren Patterson
ING Economic and Financial Analysis
Warren Patterson is a commodities strategist at ING. He joined the bank in April 2016 and covers the entire commodities complex. Previously, he worked at a commodities trade house in London.


