LE #F: Meat prices to double as Live Cattle prices rally

Live Cattle is a livestock commodity within the agriculture asset class, along with lean hogs, feeder cattle and porc cutouts. Once the feeder cattle have reached the target weigh of 1050-1500 pounds, they can be referred to as fed or live cattle. One can trade Live Cattle futures at Chicago Board of Trade in contracts of 40’000 pounds each under the ticker LE #F. Without any doubt, anticipation of the LE #F price development is of a high impact on the modern society. As a matter of fact, the price action of the cattle reflects the future meat price on the plate.
Currently, we see all commodities turning higher after a long period of depressed prices. Also, live cattle is expected to be already in a new bullish cycle. Will the rally in cattle prices make it less affordable for the broad population to eat meat?
Live Cattle Monthly Elliott Wave Analysis 02.23.2021
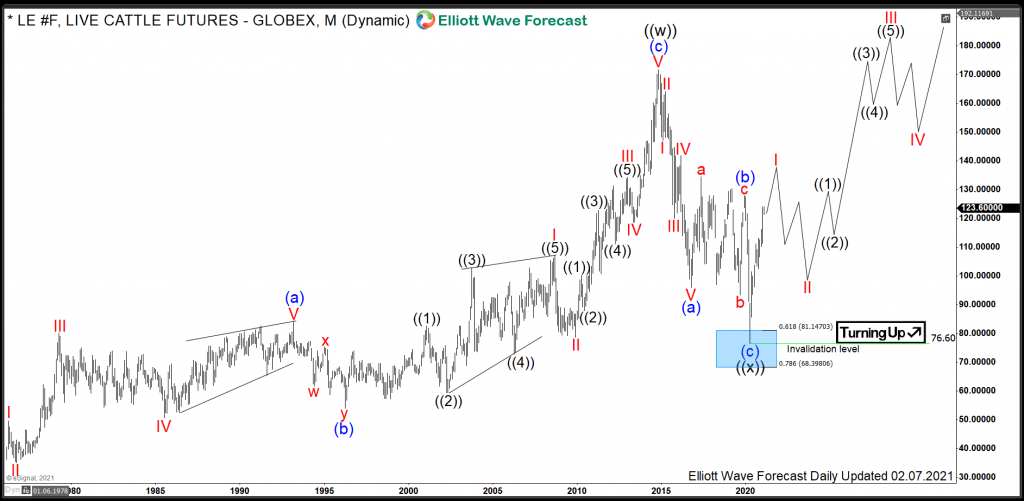
The monthly chart below shows the live cattle front contract LE #F. From the all-time lows, the prices have developed a cycle higher in black wave ((w)) of a grand super cycle degree. It has printed the all-time highs in November 2014 at 171.65. From the highs, a correction lower in wave ((x)) has unfolded as an Elliott Wave zigzag pattern. In five and half years, LE #F has become cheaper by more than 50% reaching 76.60 price level. It is the preferred view that an important bottom on April 2020 has been set and the black wave ((x)) has ended. From the lows, the recovery in prices may have started.
For 2021-2030, the expectations are to break out to the new all-time highs. The target for wave ((y)) to end will be 248-354 area.
Live Cattle Daily Elliott Wave Analysis 02.23.2021
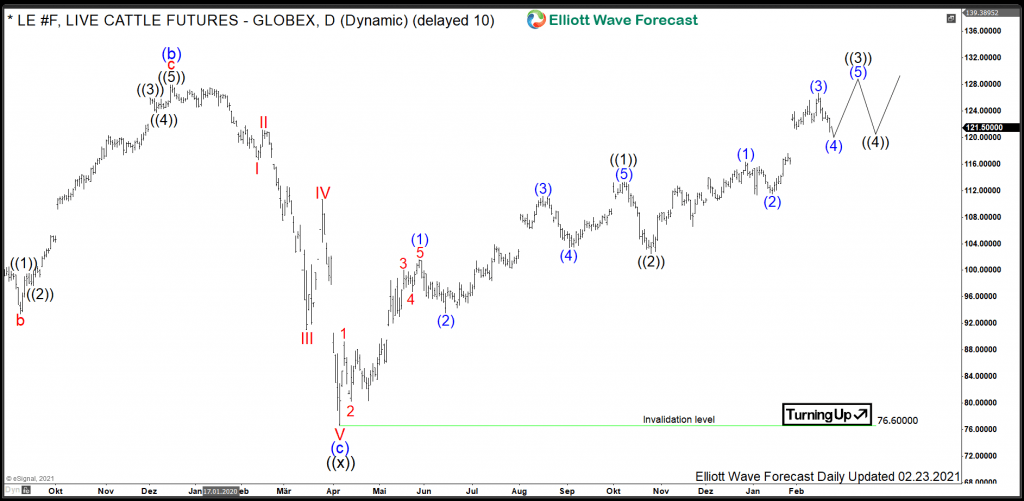
The daily chart below shows in more detail the advance from the April 2020 lows. From the bottom at 76.60, black waves ((1)) and ((2)) have ended. While above 102.52, wave ((3)) can extend higher. Later on, waves ((4))-((5)) should follow to end the advance higher in red wave I. Once accomplished, the pullback in wave II should find support in 3, 7, 11 swings for an extension higher in wave III.
Traders can be buying short-term pullbacks against 102.52 lows for more upside. Investors can be looking to buy a larger pullback in wave II in 3, 7 or 11 swings against 76.60 lows targeting 248-354 area in a long run.
Author

Elliott Wave Forecast Team
ElliottWave-Forecast.com
















