Key trading levels for the week ahead – AUD/JPY, AUD/USD, EUR/JPY, EUR/USD, GBP/JPY, and GBP/USD

Overview
Duncan Cooper summarises the key trading levels of AUD/JPY, AUD/USD, EUR/JPY, EUR/USD, GBP/JPY, and GBP/USD for the week ahead.
Last week AUD/JPY, AUD/USD, EUR/JPY, and GBP/JPY finished positive for the week. EUR/USD and GBP/USD finished down for the week. AUD/JPY, EUR/JPY, and GBP/JPY held strong gains, will they continue to strongly advance this week?
AUD/JPY daily chart
Monthly support at 90.72 and 90.29, resistance at 97.29.
Weekly support at 87.28, resistance at 94.31 and 95.73.
Daily support at 94.02 and 91.16, resistance at 94.31.
Price broke out of consolidation and tested the 94.31 weekly resistance level last week. Will price move above the 94.31 weekly resistance level this week?

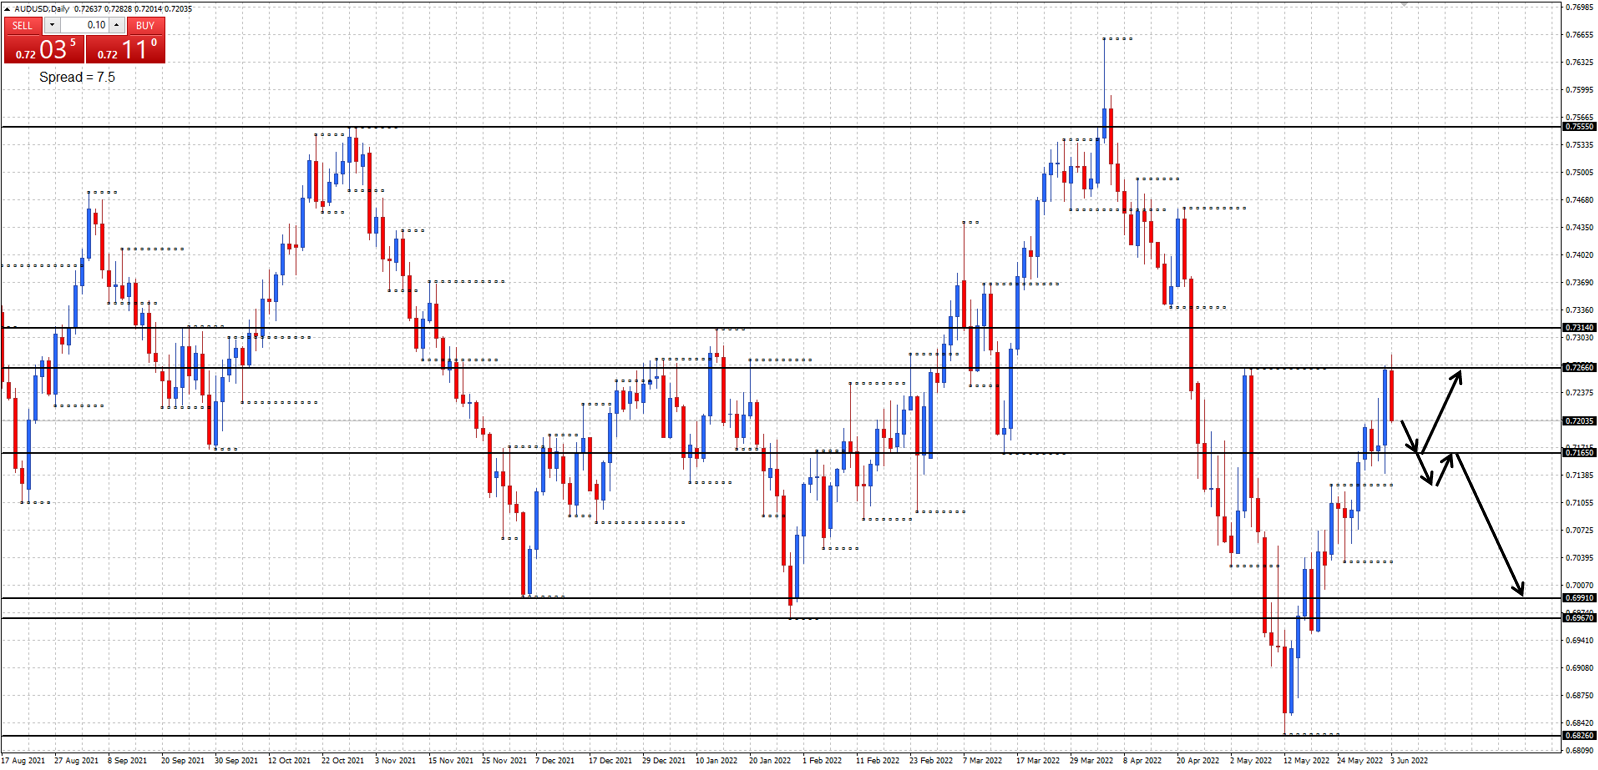
AUD/USD daily chart
Monthly support at 0.6991, 0.6967, and 0.6826, resistance at 0.7555.
Weekly support at 0.6967, resistance at 0.7314.
Daily support at 0.7165, resistance at 0.7266.
Price advanced and rejected 0.7266 daily resistance level last week. Will price hold at the 0.7266 daily resistance level and move back down to test the 0.7165 daily support level this week?
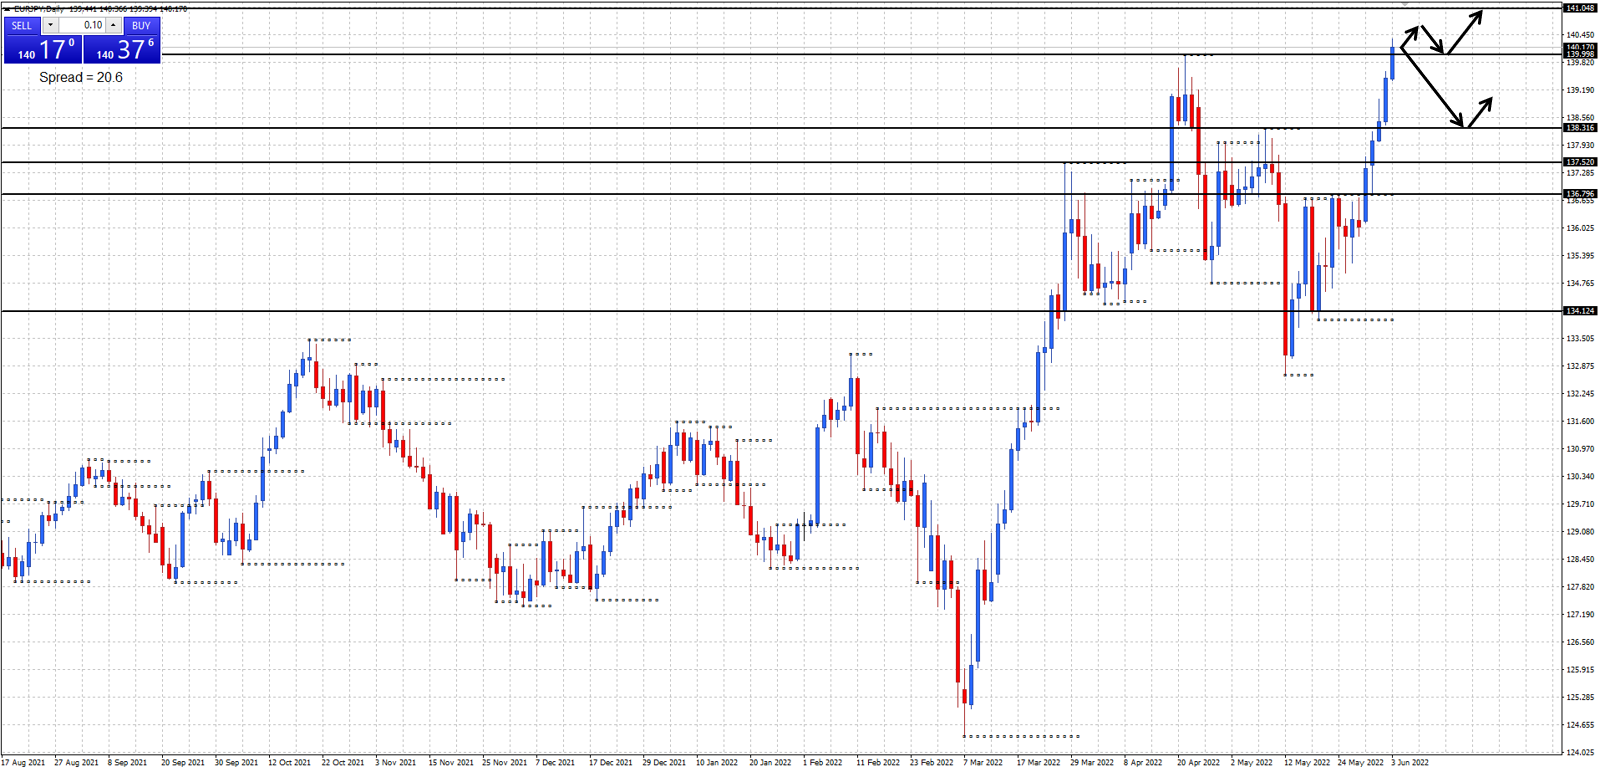
EUR/JPY daily chart
Monthly support at 137.49 and 134.12, resistance at 141.04.
Weekly support at 137.52, resistance at 139.99.
Daily support at 138.31 and 136.79, resistance at 139.99.
Price broke out of consolidation and tested the 139.99 weekly resistance level last week. Will price hold and move above the 139.99 weekly resistance level this week?
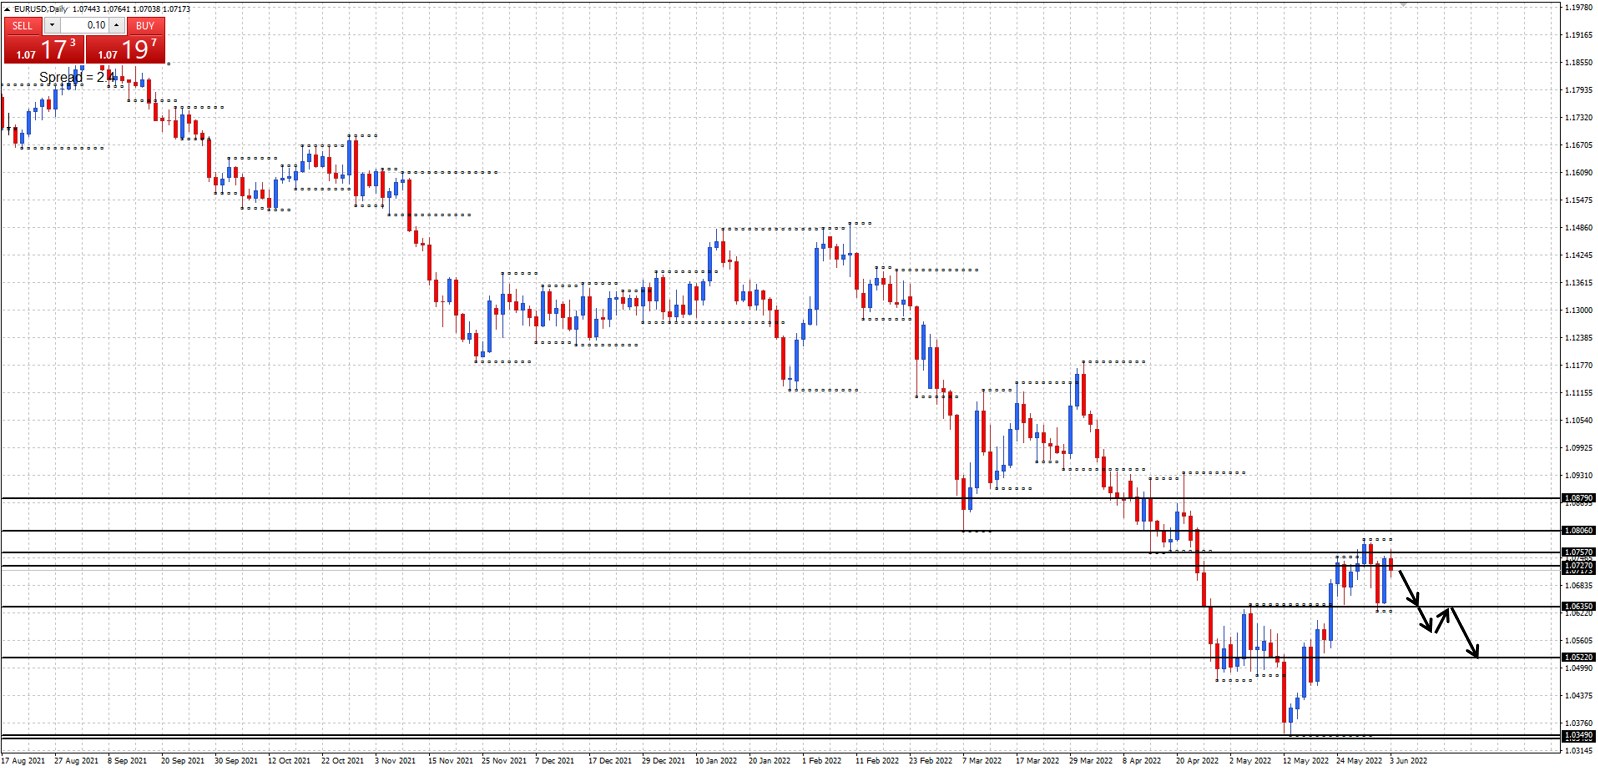
EUR/USD daily chart
Monthly support at 1.0635, 1.0522, and 1.0340, resistance at 1.0879.
Weekly support at 1.0349, resistance at 1.0727 and 1.0806.
Daily support at 1.0642 and 1.0627, resistance at 1.0748 and 1.0757.
Price held at the 1.0727-57 weekly/daily resistance area last week. Will price move back down to retest the 1.0635 monthly support level this week?
GBP/JPY daily chart
Monthly support at 158.21, resistance at 163.06 and 163.87.
Weekly support at 158.06, resistance at 168.42.
Daily support at 161.85 and 161.00, resistance at 163.57, 164.25, and 164.64.
Price advanced back to the 163.87 monthly resistance level last week. Will price continue to advance and move above the 163.87 to 164.64 monthly/daily resistance area this week?

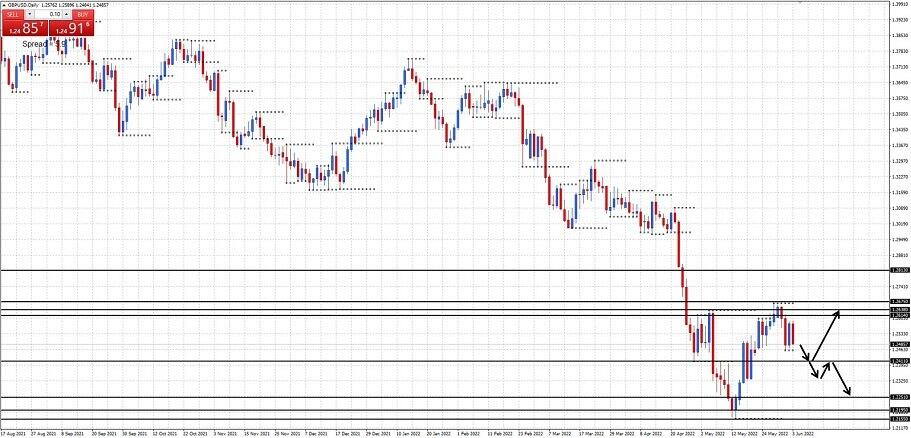
GBP/USD daily chart
Weekly support at 1.2251, 1.2195, and 1.2155, resistance at 1.2675 and 1.2813.
Daily support at 1.2411, resistance at 1.2614, 1.2638, and 1.2675.
Price held at the 1.2638 daily resistance level last week. Will price move back below the 1.2411 daily support level this week?
Author

Duncan Cooper
ACY Securities
Duncan Cooper is a full-time trader and mentor. He has been actively trading the financial markets for more than 15 years and has traded stocks, options, futures, and the Forex Market since 2005.


