Key trading levels AUD/USD, EUR/USD, GBP/USD and crosses: GBP/USD decline strongly [Video]
![Key trading levels AUD/USD, EUR/USD, GBP/USD and crosses: GBP/USD decline strongly [Video]](https://editorial.fxstreet.com/images/Markets/Currencies/Majors/GBPUSD/money-pound-sterling-gm172795697-5997711_XtraLarge.jpg)
Overview
Last week AUDJPY, AUDUSD, and EURJPY just managed to hold gains. EURUSD, GBPJPY, and GBPUSD all finished down for the week. GBPUSD continued to decline strongly and almost tested the 1.2251 weekly support level.
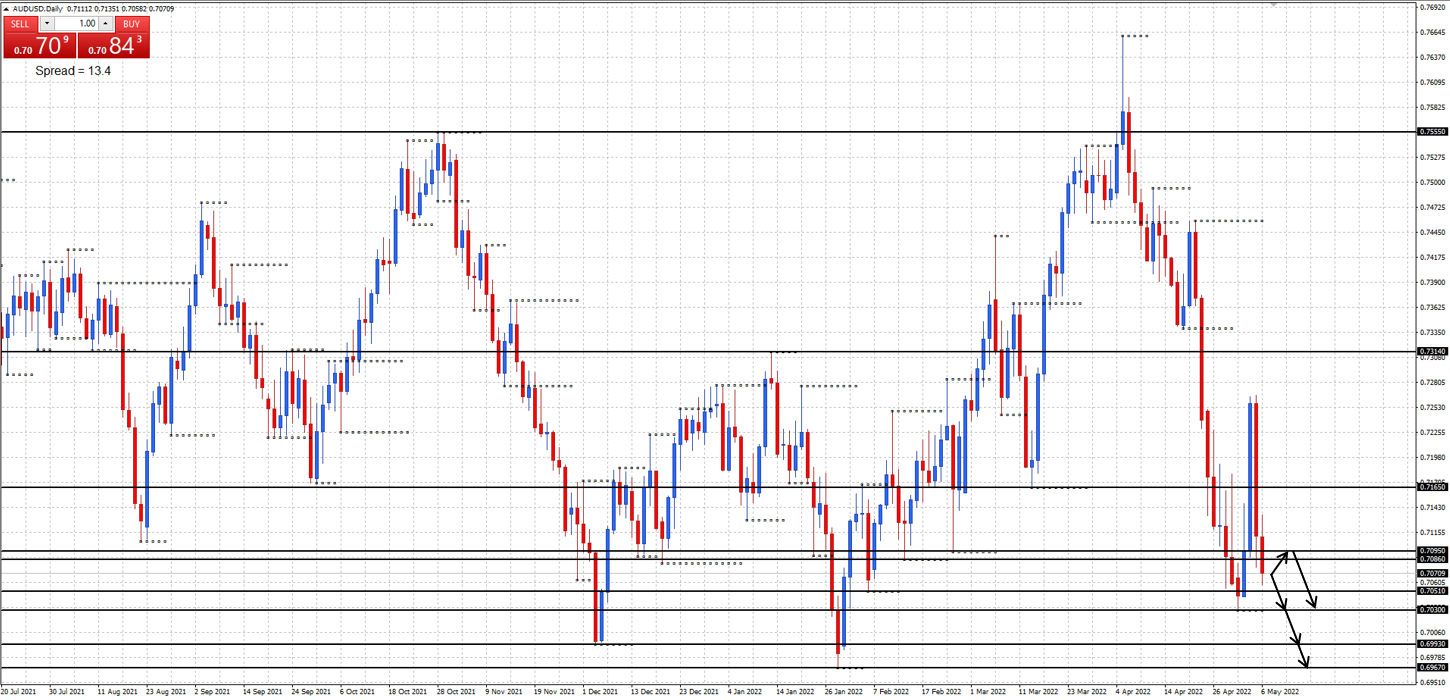
AUD/JPY daily chart
Monthly support at 90.72, 90.29, and 86.24, resistance at 97.29.
Weekly support at 90.72, resistance at 94.31 and 95.73.
Daily support at 90.75 and 90.43, resistance at 92.39, 93.07, 93.52, 93.85, and 94.15.
Price continued to hold at the 94.00 resistance area last week. Will price decline down to the 90.72 and 90.29 monthly support levels this week?
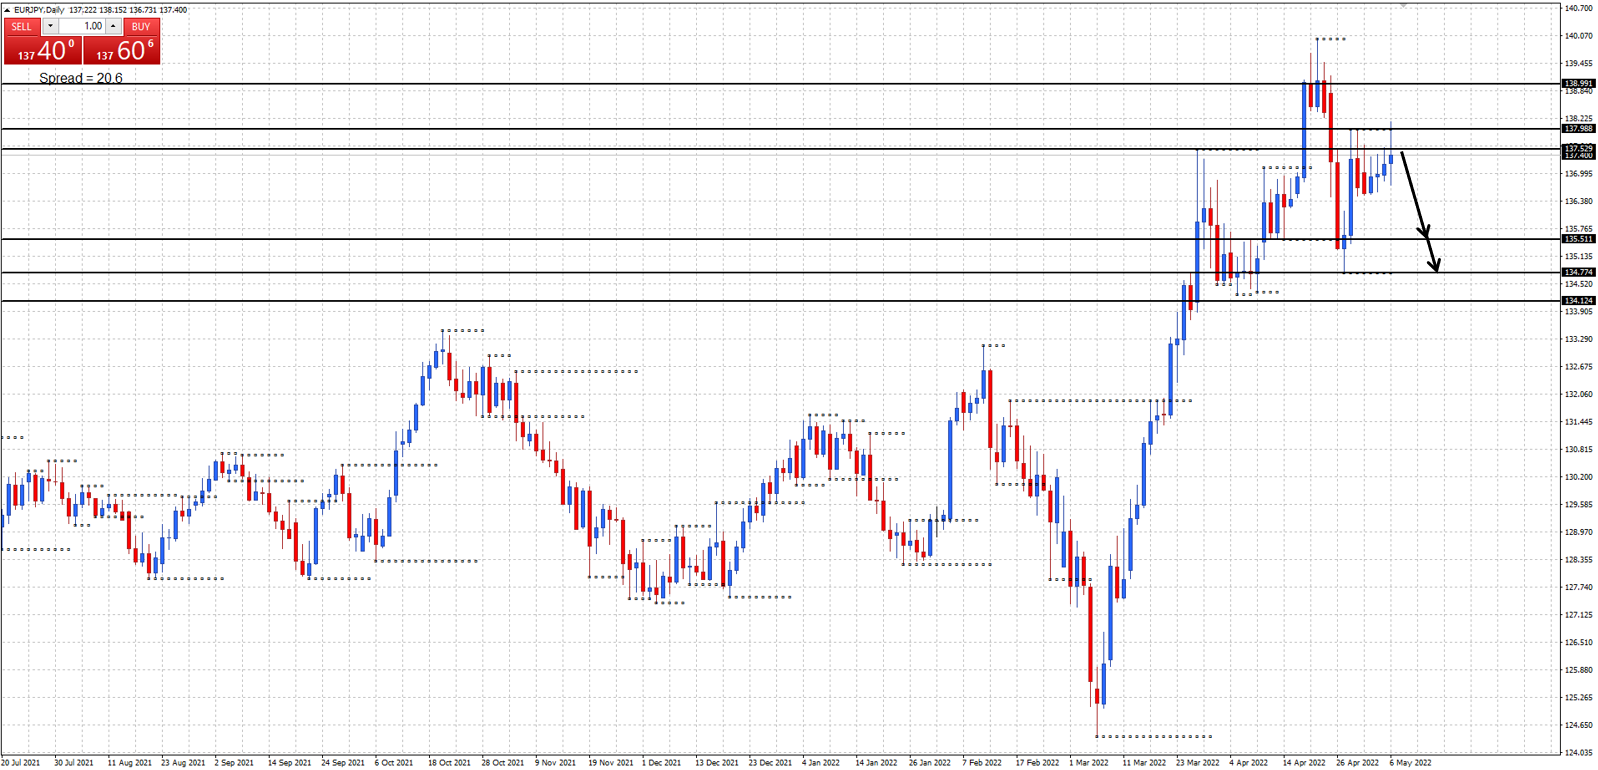
AUD/USD daily chart
Monthly support at 0.6991 and 0.6967, resistance at 0.7555.
Weekly support at 0.6993, resistance at 0.7314.
Daily support at 0.7051 and 0.7030, resistance at 0.7086, 0.7095, and 0.7165.
Price declined back below the 0.7095 and 0.7086 daily resistance levels last week. Will price continue to decline down to the 0.6993-67 weekly/monthly support area this week?
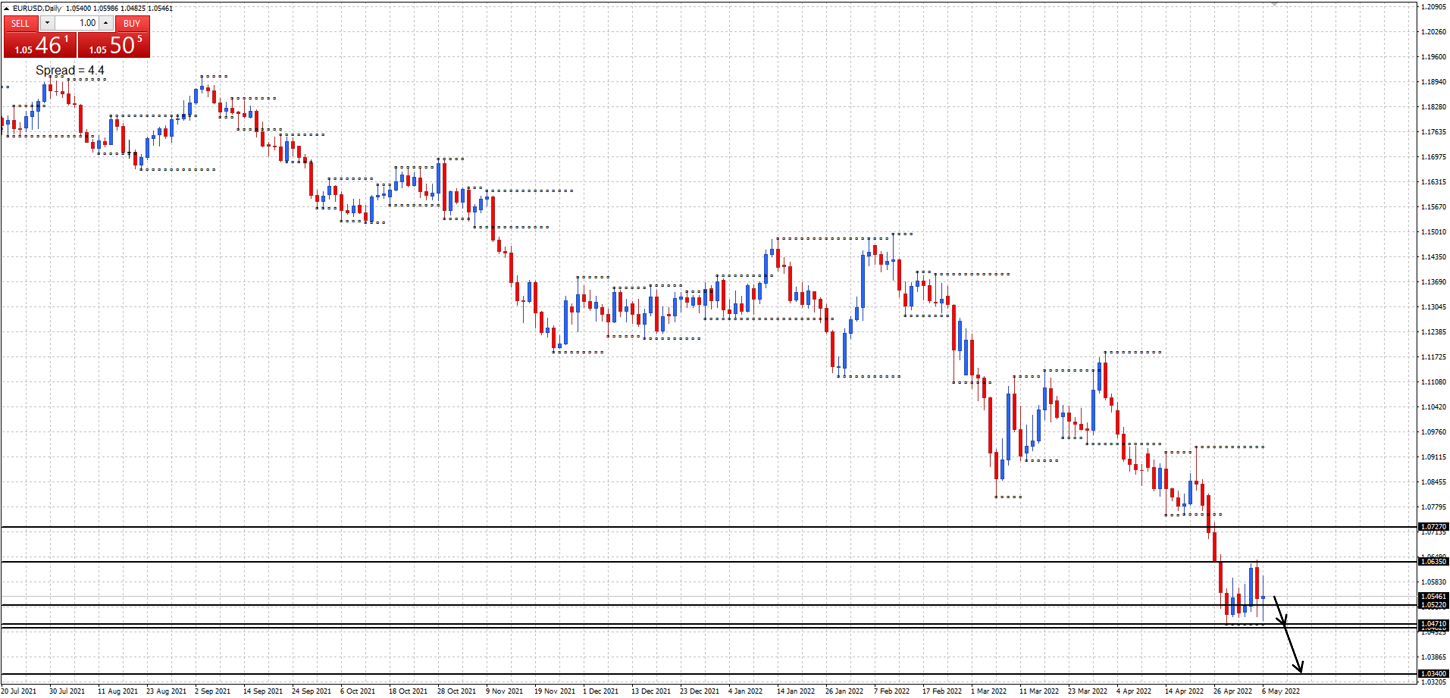
EUR/JPY daily chart
Monthly support at 134.12, resistance at 141.04.
Weekly support at 134.12, resistance at 137.52 and 138.99.
Daily support at 135.51 and 134.77, resistance at 137.98.
Price continued to hold at the 137.52 weekly resistance level last week. Will price decline down to the 135.51 and 134.77 daily support levels this week?
EUR/USD daily chart
Monthly support at 1.0522, 1.0462, and 1.0340, resistance at 1.0635.
Weekly support at 1.0522, resistance at 1.0727.
Daily support at 1.0471, resistance at 1.0635.
Price continued to hold above the 1.0522 monthly support level last week. Will price decline down and move below the 1.0522 monthly support level this week?
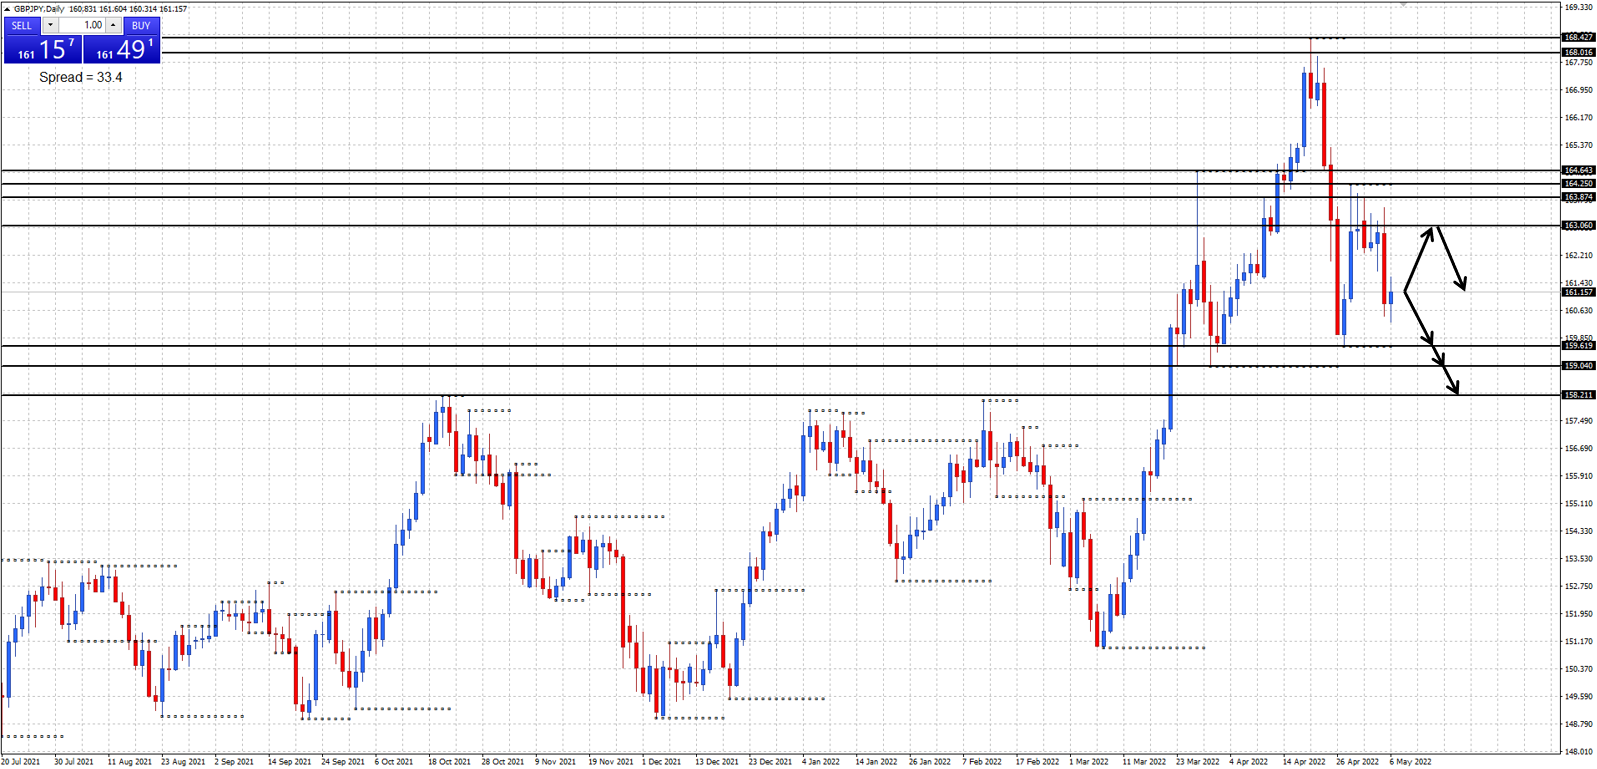
GBP/JPY daily chart
Monthly support at 158.21, resistance at 163.06, 163.87, and 168.01.
Weekly support at 158.21, resistance at 163.06.
Daily support at 159.61 and 159.04, resistance at 164.25, 164.64, and 168.42.
Price declined down from the 163.06 monthly resistance level last week. Will price continue to decline down and move below the 159.61 and 159.04 daily support levels this week?
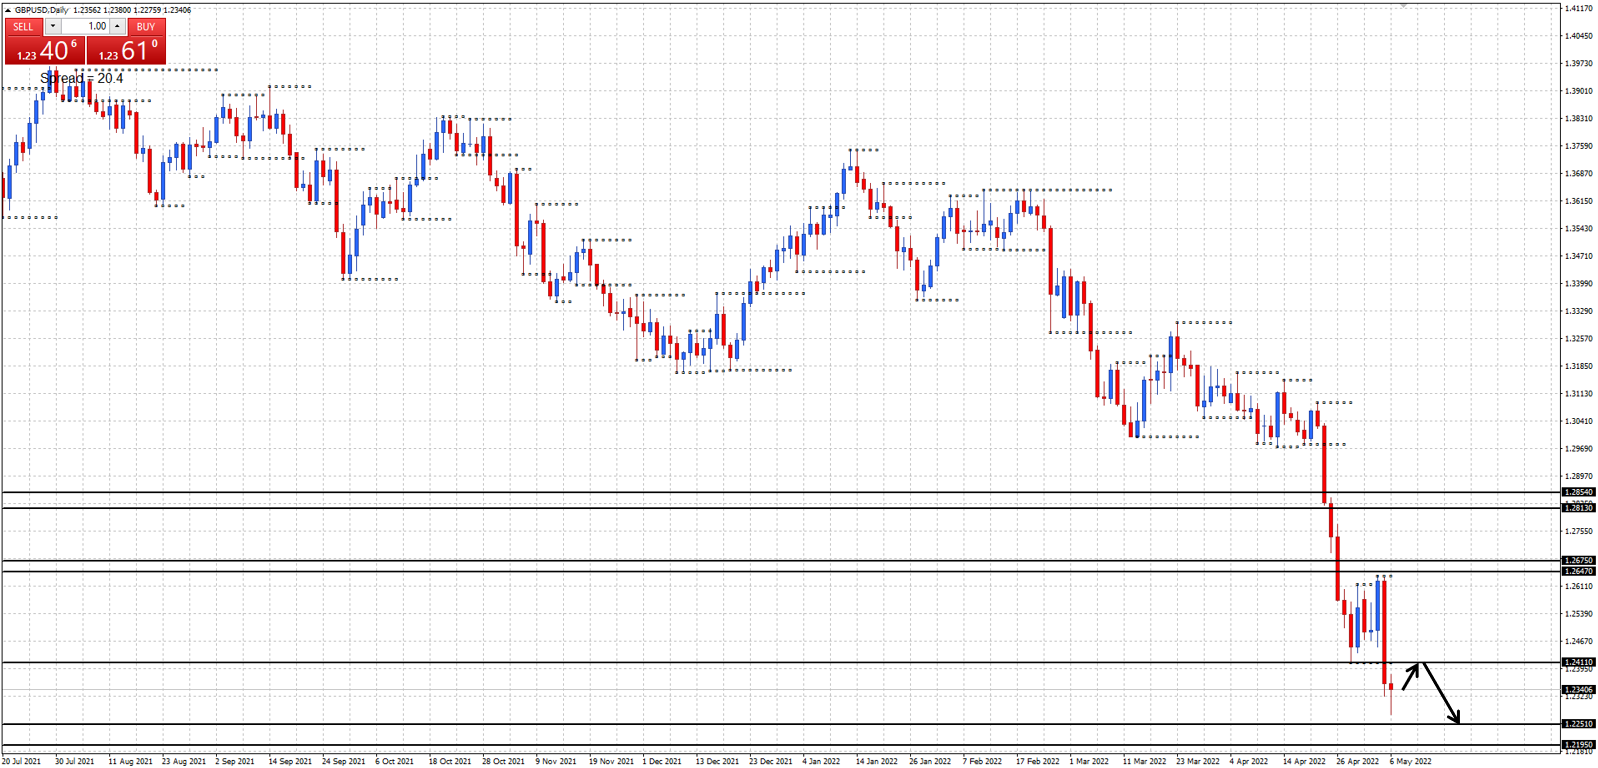
GBP/USD daily chart
Weekly support at 1.2251 and 1.2195, resistance at 1.2647, 1.2675, 1.2813, and 1.2854.
Daily support at 1.2251, resistance at 1.2411.
Price continued to decline strongly and almost tested the 1.2251 weekly support level last week. Will price continue to decline down and move below the 1.2251 weekly support level this week?
Author

Duncan Cooper
ACY Securities
Duncan Cooper is a full-time trader and mentor. He has been actively trading the financial markets for more than 15 years and has traded stocks, options, futures, and the Forex Market since 2005.


